Holiday Inn 2010 Annual Report Download - page 97
Download and view the complete annual report
Please find page 97 of the 2010 Holiday Inn annual report below. You can navigate through the pages in the report by either clicking on the pages listed below, or by using the keyword search tool below to find specific information within the annual report.-
 1
1 -
2
-
3
-
4
-
5
-
6
-
7
-
8
-
9
-
10
-
11
-
12
-
13
-
14
-
15
-
16
-
17
-
18
-
19
-
20
-
21
-
22
-
23
-
24
-
25
-
26
-
27
-
28
-
29
-
30
-
31
-
32
-
33
-
34
-
35
-
36
-
37
-
38
-
39
-
40
-
41
-
42
-
43
-
44
-
45
-
46
-
47
-
48
-
49
-
50
-
51
-
52
-
53
-
54
-
55
-
56
-
57
-
58
-
59
-
60
-
61
-
62
-
63
-
64
-
65
-
66
-
67
-
68
-
69
-
70
-
71
-
72
-
73
-
74
-
75
-
76
-
77
-
78
-
79
-
80
-
81
-
82
-
83
-
84
-
85
-
86
-
 87
87 -
 88
88 -
 89
89 -
 90
90 -
 91
91 -
 92
92 -
 93
93 -
 94
94 -
 95
95 -
 96
96 -
 97
97 -
 98
98 -
 99
99 -
 100
100 -
 101
101 -
 102
102 -
 103
103 -
 104
104 -
 105
105 -
 106
106 -
 107
107 -
108
-
109
-
110
-
111
-
112
-
113
-
114
-
115
-
116
-
117
-
118
-
119
-
120
-
121
-
122
-
123
-
124
 |
 |

OVERVIEW BUSINESS REVIEW
THE BOARD,
SENIOR MANAGEMENT AND
THEIR RESPONSIBILITIES
GROUP FINANCIAL
STATEMENTS
PARENT COMPANY
FINANCIAL STATEMENTS USEFUL INFORMATION
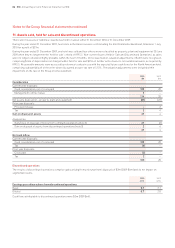
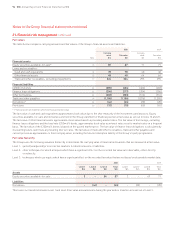
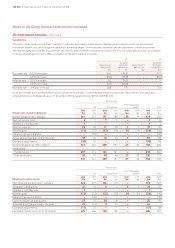
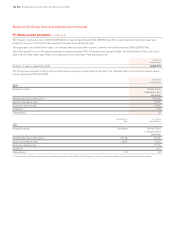
21. Financial risk management continued
The following table reconciles movements in instruments classified as Level 3 during the year:
2010 2009
$m $m
At 1 January 69 68
Additions 4 –
Repaid (5) –
Valuation gains recognised in other comprehensive income 16 11
Impairment* – (10)
At 31 December 84 69
* The impairment charge recognised in the income statement (see note 5) also includes $1m (2009 $4m) of losses reclassified from equity.
The Level 3 equity securities relate to investments in unlisted shares which are valued by applying an average price-earnings (P/E) ratio for
a competitor group to the earnings generated by the investment. A 10% increase in the average P/E ratio would result in a $4m increase in
the fair value of the investments (2009 $5m) and a 10% decrease in the average P/E ratio would result in a $4m decrease in the fair value of
the investments (2009 $5m).
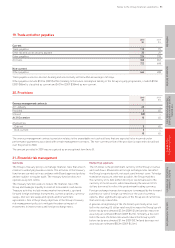
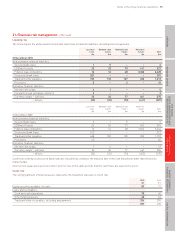
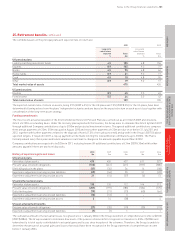
22. Loans and other borrowings
2010 2009
Current Non-current Total Current Non-current Total
$m $m $m $m $m $m
Secured bank loans 1 4 5 3 5 8
Finance leases 16 190 206 16 188 204
£250m 6% bonds – 385 385 – 402 402
Unsecured bank loans 1 197 198 87 421 508
Total borrowings 18 776 794 106 1,016 1,122
Denominated in the following currencies:
Sterling – 385 385 – 402 402
US dollars 16 287 303 103 348 451
Euro – 100 100 – 216 216
Other 2 4 6 3 50 53
18 776 794 106 1,016 1,122
Secured bank loans
These mortgages are secured on the hotel properties to which they relate. The rates of interest and currencies of these loans vary.
Non-current amounts include $4m (2009 $5m) repayable by instalments.
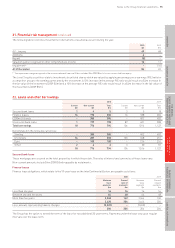
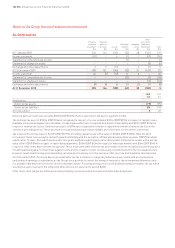
Finance leases
Finance lease obligations, which relate to the 99-year lease on the InterContinental Boston, are payable as follows:
2010 2009
Minimum Present Minimum Present
lease value of lease value of
payments payments payments payments
$m $m $m $m
Less than one year 16 16 16 16
Between one and five years 64 48 64 48
More than five years 3,348 142 3,364 140
3,428 206 3,444 204
Less: amount representing finance charges (3,222) – (3,240) –
206 206 204 204
The Group has the option to extend the term of the lease for two additional 20-year terms. Payments under the lease step up at regular
intervals over the lease term.
Notes to the Group financial statements 95