Holiday Inn 2010 Annual Report Download - page 50
Download and view the complete annual report
Please find page 50 of the 2010 Holiday Inn annual report below. You can navigate through the pages in the report by either clicking on the pages listed below, or by using the keyword search tool below to find specific information within the annual report.-
 1
1 -
2
-
3
-
4
-
5
-
6
-
7
-
8
-
9
-
10
-
11
-
12
-
13
-
14
-
15
-
16
-
17
-
18
-
19
-
20
-
21
-
22
-
23
-
24
-
25
-
26
-
27
-
28
-
29
-
30
-
31
-
32
-
33
-
34
-
35
-
36
-
37
-
38
-
39
-
 40
40 -
 41
41 -
 42
42 -
 43
43 -
 44
44 -
 45
45 -
 46
46 -
 47
47 -
 48
48 -
 49
49 -
 50
50 -
 51
51 -
 52
52 -
 53
53 -
 54
54 -
 55
55 -
 56
56 -
 57
57 -
 58
58 -
 59
59 -
 60
60 -
61
-
62
-
63
-
64
-
65
-
66
-
67
-
68
-
69
-
70
-
71
-
72
-
73
-
74
-
75
-
76
-
77
-
78
-
79
-
80
-
81
-
82
-
83
-
84
-
85
-
86
-
87
-
88
-
89
-
90
-
91
-
92
-
93
-
94
-
95
-
96
-
97
-
98
-
99
-
100
-
101
-
102
-
103
-
104
-
105
-
106
-
107
-
108
-
109
-
110
-
111
-
112
-
113
-
114
-
115
-
116
-
117
-
118
-
119
-
120
-
121
-
122
-
123
-
124
 |
 |

48 IHG Annual Report and Financial Statements 2010
Remuneration in 2011
During 2010, the Remuneration Committee spent a significant
amount of time considering more strategically relevant long-term
performance measures, which also drive shareholder value. Based
on this review and consultation with key institutional shareholders,
the Committee concluded that relative TSR remains well aligned
with the goal of achieving enduring top quartile returns; hence TSR
will continue to account for 50% of the LTIP weighting.
However, the Committee also resolved that the LTIP would be
better aligned with strategy by replacing EPS with two equally
weighted measures – net Rooms growth and like-for-like RevPAR
growth, both relative to major competitors.
Both net Rooms growth and RevPAR underpin IHG’s strategy
to drive shareholder value and have high relevance for most
employees. Net Rooms growth focuses on the goal to increase
system size. Like-for-like RevPAR growth reflects the importance
of revenue share, guest preference and overall brand strength.
After testing the performance conditions set on grant, the
Committee will review the vesting outcomes of the Rooms and
RevPAR measures against an assessment of earnings and quality
of the financial performance of the Company over the period. The
Committee may reduce the number of shares which vest if they
determine such an adjustment is appropriate. IHG’s performance
and vesting outcomes will be fully disclosed and explained in the
relevant Remuneration Report.
The Committee is determined that the overall incentive package
is based on an appropriate balance of performance measures.
Earnings growth continues to account for a significant part of
executive incentives, due to the 70% weighting of EBIT in the
Annual Bonus Plan (increased from 50% in 2009).
In addition, the following changes have been made to executive
remuneration arrangements for 2011:
• the maximum bonus opportunity will revert from 175% to 200%
of base salary;
• the EBIT target for maximum bonus achievement will revert from
120% to 110% of budget; and
• the maximum LTIP award will be maintained at 205% of base
salary.
In conclusion, the Committee believes that these changes will
lead to greater management focus on the key drivers of superior
performance, and that they are well aligned with the goal of
increasing shareholding value.
Ralph Kugler
Chairman of the Remuneration Committee
14 February 2011
Dear Shareholder
I am pleased to present the Directors’ Remuneration Report
for 2010.
The year started with significant uncertainty and volatility in the
economic environment. Early industry forecasts projected declining
revenue per available room (RevPAR) for 2010, including –4% for
the US market. However, by the end of 2010, the US market had
achieved 5.5% growth in RevPAR. Market conditions improved
progressively throughout the year as consumer confidence
strengthened.
For IHG, global RevPAR grew 6.2% and rates are now showing
positive growth in all regions. Other key performance indicators
also improved:
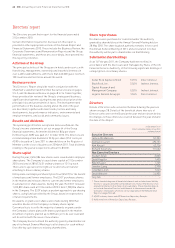
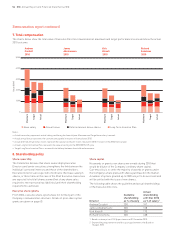
2010 Key performance indicator growth
(per annum) 2010 2009
Earnings before interest and tax (EBIT) +22.6% –34%
Revenue per available room (RevPAR) +6.2% –14.7%
Employee engagement +3% +1%
Three-year total shareholder return (TSR)* +8% –8.7%
Three-year adjusted earnings per share (EPS)* +9.6% +15.2%
* Annualised.
Based on these results, annual bonus outcomes in respect of 2010
were 175% of base salary. The Remuneration Committee believes
this to be an appropriate reflection of a strong recovery, noting that
results significantly exceeded expectation at the start of the year.
Remuneration in 2010
No annual bonus payments were made in respect of 2009. Robust
links between performance and reward were maintained in 2010
incentive plan designs. Targets were set at a challenging level in
relation to IHG’s strategic goals and to external analyst consensus.
In light of the high level of continuing uncertainty in the industry, the
Committee put in place the following safeguards for 2010 executive
remuneration:
Annual Bonus Plan (ABP)
• the maximum bonus opportunity was temporarily capped at
175% of base salary;
• the target for maximum bonus achievement was temporarily
increased from 110% to 120% for EBIT;
• the weighting of EBIT remained at 70% to ensure a continued
strong focus on earnings; and
• as first introduced in 2009, no bonus is payable if EBIT
performance is lower than 85% of target.
Long Term Incentive Plan (LTIP)
• maximum award levels were maintained at 205% of base salary
(previously 270%); and
• EPS and relative TSR performance measures were restored to
50% weighting each.
Salaries were increased by an average of 2.8% following no
increase in 2009.
The above actions were also applied to 2010 remuneration for
all other Executive Committee members.
Remuneration report