Holiday Inn 2010 Annual Report Download - page 102
Download and view the complete annual report
Please find page 102 of the 2010 Holiday Inn annual report below. You can navigate through the pages in the report by either clicking on the pages listed below, or by using the keyword search tool below to find specific information within the annual report.-
 1
1 -
2
-
3
-
4
-
5
-
6
-
7
-
8
-
9
-
10
-
11
-
12
-
13
-
14
-
15
-
16
-
17
-
18
-
19
-
20
-
21
-
22
-
23
-
24
-
25
-
26
-
27
-
28
-
29
-
30
-
31
-
32
-
33
-
34
-
35
-
36
-
37
-
38
-
39
-
40
-
41
-
42
-
43
-
44
-
45
-
46
-
47
-
48
-
49
-
50
-
51
-
52
-
53
-
54
-
55
-
56
-
57
-
58
-
59
-
60
-
61
-
62
-
63
-
64
-
65
-
66
-
67
-
68
-
69
-
70
-
71
-
72
-
73
-
74
-
75
-
76
-
77
-
78
-
79
-
80
-
81
-
82
-
83
-
84
-
85
-
86
-
87
-
88
-
89
-
90
-
91
-
 92
92 -
 93
93 -
 94
94 -
 95
95 -
 96
96 -
 97
97 -
 98
98 -
 99
99 -
 100
100 -
 101
101 -
 102
102 -
 103
103 -
 104
104 -
 105
105 -
 106
106 -
 107
107 -
 108
108 -
 109
109 -
 110
110 -
 111
111 -
 112
112 -
113
-
114
-
115
-
116
-
117
-
118
-
119
-
120
-
121
-
122
-
123
-
124
 |
 |

100 IHG Annual Report and Financial Statements 2010
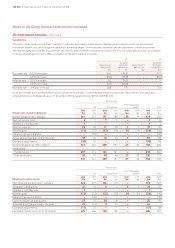
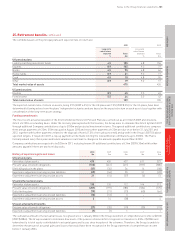
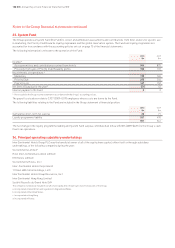
25. Retirement benefits continued
Sensitivities
The value of plan assets is sensitive to market conditions, particularly equity values. Changes in assumptions used for determining
retirement benefit costs and obligations may have a material impact on the income statement and the statement of financial position.
The main assumptions are the discount rate, the rate of inflation and the assumed mortality rate. The following table provides an estimate
of the potential impact of each of these variables on the principal pension plans.
UK US
Increase/ Increase/
Higher/(lower) (decrease) Higher/(lower) (decrease)
pension cost in liabilities pension cost in liabilities
$m $m $m $m
Discount rate – 0.25% decrease 0.6 25.8 – 5.9
– 0.25% increase (0.6) (25.8) – (5.6)
Inflation rate – 0.25% increase 1.6 24.8 – –
– 0.25% decrease (1.6) (24.8) – –
Mortality rate – one year increase 0.8 9.9 – 7.6
A one percentage point increase/(decrease) in assumed healthcare costs trend rate would increase/(decrease) the accumulated post-
employment benefit obligations as of 31 December 2010 by approximately $2.5m (2009 $1.6m).
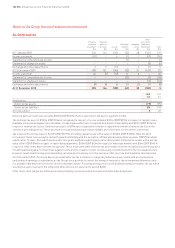
Pension plans
Post-employment
UK US and other benefits Total
2010 2009 2010 2009 2010 2009 2010 2009
Movement in benefit obligation $m $m $m $m $m $m $m $m
Benefit obligation at 1 January 461 411 197 185 20 19 678 615
Current service cost 6 7 1 1 – – 7 8
Members’ contributions 1 1 – – – – 1 1
Interest expense 25 22 11 10 1 1 37 33
Benefits paid (12) (12) (13) (13) (1) (1) (26) (26)
Enhanced pension transfer – (59) – – – – – (59)
Actuarial loss/(gain) arising in the year 49 44 13 13 7 1 69 58
Exchange adjustments (18) 47 – 1 – – (18) 48
Benefit obligation at 31 December 512 461 209 197 27 20 748 678
Comprising:
Funded plans 457 414 161 151 – – 618 565
Unfunded plans 55 47 48 46 27 20 130 113
512 461 209 197 27 20 748 678
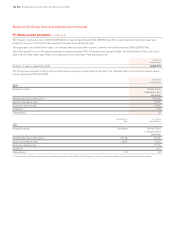
Pension plans
Post-employment
UK US and other benefits Total
2010 2009 2010 2009 2010 2009 2010 2009
Movement in plan assets $m $m $m $m $m $m $m $m
Fair value of plan assets at 1 January 426 437 126 112 – – 552 549
Company contributions 31 16 4 4 1 1 36 21
Members’ contributions 1 1 – – – – 1 1
Benefits paid (12) (12) (13) (13) (1) (1) (26) (26)
Enhanced pension transfer – (70) – – – – – (70)
Expected return on plan assets 25 21 10 8 – – 35 29
Actuarial (loss)/gain arising in the year 21 (14) 3 14 – – 24 –
Exchange adjustments (17) 47 – 1 – – (17) 48
Fair value of plan assets at 31 December 475 426 130 126 – – 605 552
Notes to the Group financial statements continued