Holiday Inn 2010 Annual Report Download - page 22
Download and view the complete annual report
Please find page 22 of the 2010 Holiday Inn annual report below. You can navigate through the pages in the report by either clicking on the pages listed below, or by using the keyword search tool below to find specific information within the annual report.-
 1
1 -
2
-
3
-
4
-
5
-
6
-
7
-
8
-
9
-
10
-
11
-
 12
12 -
 13
13 -
 14
14 -
 15
15 -
 16
16 -
 17
17 -
 18
18 -
 19
19 -
 20
20 -
 21
21 -
 22
22 -
 23
23 -
 24
24 -
 25
25 -
 26
26 -
 27
27 -
 28
28 -
 29
29 -
 30
30 -
 31
31 -
 32
32 -
33
-
34
-
35
-
36
-
37
-
38
-
39
-
40
-
41
-
42
-
43
-
44
-
45
-
46
-
47
-
48
-
49
-
50
-
51
-
52
-
53
-
54
-
55
-
56
-
57
-
58
-
59
-
60
-
61
-
62
-
63
-
64
-
65
-
66
-
67
-
68
-
69
-
70
-
71
-
72
-
73
-
74
-
75
-
76
-
77
-
78
-
79
-
80
-
81
-
82
-
83
-
84
-
85
-
86
-
87
-
88
-
89
-
90
-
91
-
92
-
93
-
94
-
95
-
96
-
97
-
98
-
99
-
100
-
101
-
102
-
103
-
104
-
105
-
106
-
107
-
108
-
109
-
110
-
111
-
112
-
113
-
114
-
115
-
116
-
117
-
118
-
119
-
120
-
121
-
122
-
123
-
124
 |
 |

Business review continued
20 IHG Annual Report and Financial Statements 2010
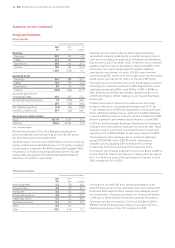
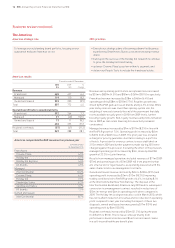
Asia Pacific results
12 months ended 31 December
2010 2009 %
$m $m change
Revenue
Franchised 12 11 9.1
Managed 155 105 47.6
Owned and leased 136 129 5.4
Total 303 245 23.7
Operating profit before exceptional items
Franchised 7 5 40.0
Managed 73 44 65.9
Owned and leased 35 30 16.7
115 79 45.6
Regional overheads (26) (27) 3.7
Total 89 52 71.2
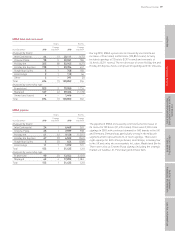
Asia Pacific comparable RevPAR movement on previous year
12 months ended
31 December 2010
Managed – all brands
Asia Pacific 13.4%
Greater China 26.7%
Owned and leased
InterContinental 15.3%
All ownership types
Greater China 25.8%
Asia Pacific revenue and operating profit before exceptional
items increased by $58m to $303m (23.7%) and by $37m to
$89m (71.2%) respectively.
Continued strong economic growth in the region was given a
further boost by the World Expo held in Shanghai from May to
October 2010. Resulting RevPAR growth in key Chinese cities
was exceptional, with Shanghai and Beijing growing 55.9% and
29.9% respectively.
Franchised revenue increased by $1m to $12m (9.1%)
and operating profit grew by $2m to $7m (40.0%).
Managed revenue increased by $50m to $155m (47.6%) and
operating profit increased by $29m to $73m (65.9%). In addition
to strong comparable RevPAR performance, there was a positive
contribution from recently opened hotels, with a 9% room increase
in the size of the Asia Pacific managed estate during the year
following a 10% increase in 2009, and a $4m operating profit
benefit due to the collection of old or previously provided for debts.
In the owned and leased estate, revenue increased by $7m
to $136m (5.4%) and operating profit by $5m to $35m (16.7%).
These results were driven by the InterContinental Hong Kong,
where RevPAR increased 15.3% during the year.
Regional overheads decreased by $1m to $26m (3.7%), with
an increase in performance based incentive costs offset by the
effect of the 2009 restructuring.
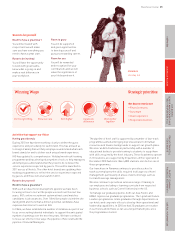
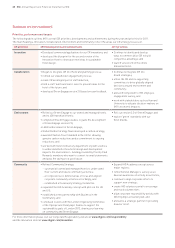
Asia Pacific
Asia Pacific strategic role 2011 priorities
Within the region, Greater China is one of the specific growth
opportunities and will be a major contributor to IHG, where we
can leverage scale, drive margin and expand our outstanding
portfolio of brands, whilst the focus in Asia Australasia is to
drive profitable growth in emerging key markets and cities.
• Execute our strategic plans of becoming a brand-led business
by delivering Great Hotels Guests Love and increasing revenue
share;
• grow our portfolio of brands in key strategic markets,
especially India and resort locations;
• continue rapid expansion, particularly of our upscale brands,
in established and emerging cities in China;
• build upon the success of the Holiday Inn relaunch to continue
to grow the Holiday Inn brand family; and
• localise systems, processes, brands and People Tools to drive
efficiency, consumer preference and margin performance.