Holiday Inn 2010 Annual Report Download - page 60
Download and view the complete annual report
Please find page 60 of the 2010 Holiday Inn annual report below. You can navigate through the pages in the report by either clicking on the pages listed below, or by using the keyword search tool below to find specific information within the annual report.-
 1
1 -
2
-
3
-
4
-
5
-
6
-
7
-
8
-
9
-
10
-
11
-
12
-
13
-
14
-
15
-
16
-
17
-
18
-
19
-
20
-
21
-
22
-
23
-
24
-
25
-
26
-
27
-
28
-
29
-
30
-
31
-
32
-
33
-
34
-
35
-
36
-
37
-
38
-
39
-
40
-
41
-
42
-
43
-
44
-
45
-
46
-
47
-
48
-
49
-
 50
50 -
 51
51 -
 52
52 -
 53
53 -
 54
54 -
 55
55 -
 56
56 -
 57
57 -
 58
58 -
 59
59 -
 60
60 -
 61
61 -
 62
62 -
 63
63 -
 64
64 -
 65
65 -
 66
66 -
 67
67 -
 68
68 -
 69
69 -
 70
70 -
71
-
72
-
73
-
74
-
75
-
76
-
77
-
78
-
79
-
80
-
81
-
82
-
83
-
84
-
85
-
86
-
87
-
88
-
89
-
90
-
91
-
92
-
93
-
94
-
95
-
96
-
97
-
98
-
99
-
100
-
101
-
102
-
103
-
104
-
105
-
106
-
107
-
108
-
109
-
110
-
111
-
112
-
113
-
114
-
115
-
116
-
117
-
118
-
119
-
120
-
121
-
122
-
123
-
124
 |
 |

58 IHG Annual Report and Financial Statements 2010
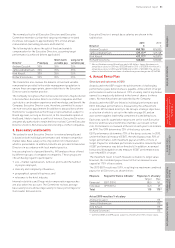
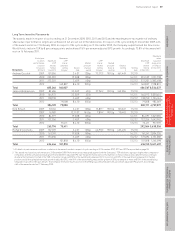
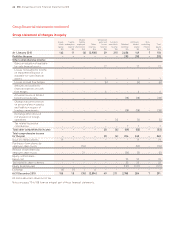
Annual Bonus Plan deferred share awards
All Directors participated in the ABP during the year ended 31 December 2010. No matching shares are provided on awards. Directors’
pre-tax share interests during the year were as follows:
Value
Financial based
year on ABP on share
which ABP ABP Market shares Market ABP price of
performance awards awards price per vested price per Value at awards Planned 1243p at
is based held at during Award share at during Vesting share at vesting held at vesting 31 Dec 2010
Directors for award* 1 Jan 2010 the year date award the year date vesting £ 31 Dec 2010 date £
Andrew Cosslett 2006 55,870 26.2.07 1235p 55,870 26.2.10 914.66p 511,021
2007 71,287 25.2.08 819.67p 71,287 25.2.11 886,097
2008 104,652 23.2.09 472.67p 104,652 23.2.12 1,300,824
2009 – – – –
Total 231,809 175,939 2,186,921
James Abrahamson 2009 – – – –
Total – – –
Kirk Kinsell 2006 13,610 26.2.07 1235p 13,610 26.2.10 914.66p 124,485
2007 19,731 25.2.08 819.67p 19,731 25.2.11 245,256
2008 41,427 23.2.09 472.67p 41,427 23.2.12 514,938
2009 – – – –
Total 74,768 61,158 760,194
Richard Solomons 2006 35,757 26.2.07 1235p 35,757 26.2.10 914.66p 327,055
2007 45,634 25.2.08 819.67p 45,634 25.2.11 567,231
2008 66,549 23.2.09 472.67p 66,549 23.2.12 827,204
2009 – – – –
Total 147,940 112,183 1,394,435
* For financial year 2006, the award was based on EPS and EBIT measures and total shares held include matching shares. For financial year 2007, the award was based on
Group EBIT and net annual rooms additions measures and total shares held include matching shares. For financial year 2008, the award was based on Group EBIT, net
annual rooms additions and individual performance measures. No matching shares were awarded. For financial year 2009, no bonus was paid.
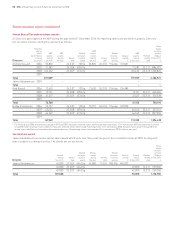
Special share award
James Abrahamson received a special share award which vests over three years as part of his recruitment terms in 2009. Vesting each
year is subject to continued service. The details are set out below:
Value
based
on share
Market Shares Market price of
Awards price per vested price per Value at Awards Planned 1243p at
held at Award share at during Vesting share at vesting held at vesting 31 Dec 2010
Director 1 Jan 2010 date award the year date vesting £ 31 Dec 2010 date £
James Abrahamson 45,000 23.2.09 454.25p 45,000 17.2.10 900.07p 405,032
45,000 23.2.09 454.25p 45,000 16.2.11 559,350
45,000 23.2.09 454.25p 45,000 15.2.12 559,350
Total 135,000 90,000 1,118,700
Remuneration report continued