Foot Locker 2011 Annual Report Download - page 86
Download and view the complete annual report
Please find page 86 of the 2011 Foot Locker annual report below. You can navigate through the pages in the report by either clicking on the pages listed below, or by using the keyword search tool below to find specific information within the annual report.-
 1
1 -
2
-
3
-
4
-
5
-
6
-
7
-
8
-
9
-
10
-
11
-
12
-
13
-
14
-
15
-
16
-
17
-
18
-
19
-
20
-
21
-
22
-
23
-
24
-
25
-
26
-
27
-
28
-
29
-
30
-
31
-
32
-
33
-
34
-
35
-
36
-
37
-
38
-
39
-
40
-
41
-
42
-
43
-
44
-
45
-
46
-
47
-
48
-
49
-
50
-
51
-
52
-
53
-
54
-
55
-
56
-
57
-
58
-
59
-
60
-
61
-
62
-
63
-
64
-
65
-
66
-
67
-
68
-
69
-
70
-
71
-
72
-
73
-
74
-
75
-
 76
76 -
 77
77 -
 78
78 -
 79
79 -
 80
80 -
 81
81 -
 82
82 -
 83
83 -
 84
84 -
 85
85 -
 86
86 -
 87
87 -
 88
88 -
 89
89 -
 90
90 -
 91
91 -
 92
92 -
 93
93 -
 94
94 -
 95
95 -
 96
96 -
97
-
98
-
99
-
100
-
101
-
102
-
103
-
104
-
105
-
106
-
107
-
108
 |
 |

FOOT LOCKER, INC.
NOTES TO CONSOLIDATED FINANCIAL STATEMENTS
21. Share-Based Compensation − (continued)
The Company estimates the expected term of share-based awards granted using the Company’s historical
exercise and post-vesting employment termination patterns, which it believes are representative of future
behavior. The expected term for the employee stock purchase plan valuation is based on the length of each
purchase period as measured at the beginning of the offering period, which is one year. The Company
estimates the expected volatility of its common stock at the grant date using a weighted-average of the
Company’s historical volatility and implied volatility from traded options on the Company’s common stock.
The Company believes that the combination of historical volatility and implied volatility provides a better
estimate of future stock price volatility. The risk-free interest rate assumption is determined using the
Federal Reserve nominal rates for U.S. Treasury zero-coupon bonds with maturities similar to those of the
expected term of the award being valued. The expected dividend yield is derived from the Company’s
historical experience. The Company records stock-based compensation expense only for those awards
expected to vest using an estimated forfeiture rate based on its historical pre-vesting forfeiture data. The
Company estimates pre-vesting option forfeitures at the time of grant and periodically revises those
estimates in subsequent periods if actual forfeitures differ from those estimates.
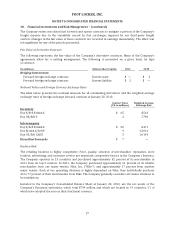
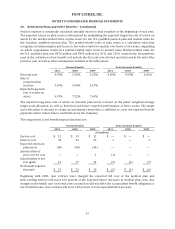
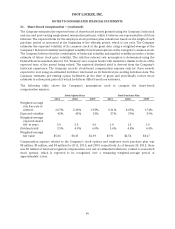
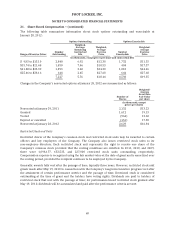
The following table shows the Company’s assumptions used to compute the share-based
compensation expense:
Stock Option Plans Stock Purchase Plan
2011 2010 2009 2011 2010 2009
Weighted-average
risk free rate of
interest 2.07% 2.34% 1.93% 0.31% 0.85% 1.74%
Expected volatility 45% 45% 53% 37% 39% 39%
Weighted-average
expected award
life- in years 5.0 5.0 4.6 1.0 1.0 1.0
Dividend yield 3.5% 4.0% 6.0% 3.4% 4.8% 4.4%
Weighted-average
fair value $5.86 $4.47 $2.89 $3.91 $2.54 $4.17
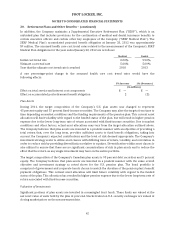
Compensation expense related to the Company’s stock options and employee stock purchase plan was
$8 million, $5 million, and $4 million for 2011, 2010, and 2009, respectively. As of January 28, 2012, there
was $5 million of total unrecognized compensation cost, net of estimated forfeitures, related to nonvested
stock options, which is expected to be recognized over a remaining weighted-average period of
approximately 1 year.
66