Foot Locker 2011 Annual Report Download - page 33
Download and view the complete annual report
Please find page 33 of the 2011 Foot Locker annual report below. You can navigate through the pages in the report by either clicking on the pages listed below, or by using the keyword search tool below to find specific information within the annual report.-
 1
1 -
2
-
3
-
4
-
5
-
6
-
7
-
8
-
9
-
10
-
11
-
12
-
13
-
14
-
15
-
16
-
17
-
18
-
19
-
20
-
21
-
22
-
 23
23 -
 24
24 -
 25
25 -
 26
26 -
 27
27 -
 28
28 -
 29
29 -
 30
30 -
 31
31 -
 32
32 -
 33
33 -
 34
34 -
 35
35 -
 36
36 -
 37
37 -
 38
38 -
 39
39 -
 40
40 -
 41
41 -
 42
42 -
 43
43 -
44
-
45
-
46
-
47
-
48
-
49
-
50
-
51
-
52
-
53
-
54
-
55
-
56
-
57
-
58
-
59
-
60
-
61
-
62
-
63
-
64
-
65
-
66
-
67
-
68
-
69
-
70
-
71
-
72
-
73
-
74
-
75
-
76
-
77
-
78
-
79
-
80
-
81
-
82
-
83
-
84
-
85
-
86
-
87
-
88
-
89
-
90
-
91
-
92
-
93
-
94
-
95
-
96
-
97
-
98
-
99
-
100
-
101
-
102
-
103
-
104
-
105
-
106
-
107
-
108
 |
 |

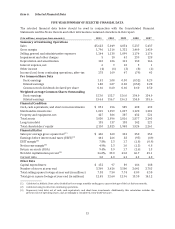
Item 6. Selected Financial Data
FIVE-YEAR SUMMARY OF SELECTED FINANCIAL DATA
The selected financial data below should be read in conjunction with the Consolidated Financial
Statements and the Notes thereto and other information contained elsewhere in this report.
($ in millions, except per share amounts) 2011 2010 2009 2008 2007
Summary of Continuing Operations
Sales $5,623 5,049 4,854 5,237 5,437
Gross margin 1,796 1,516 1,332 1,460 1,420
Selling, general and administrative expenses 1,244 1,138 1,099 1,174 1,176
Impairment and other charges 5 10 41 259 128
Depreciation and amortization 110 106 112 130 166
Interest expense, net 6 9 10 5 1
Other income (4) (4) (3) (8) (1)
Income (loss) from continuing operations, after-tax 278 169 47 (79) 43
Per Common Share Data
Basic earnings 1.81 1.08 0.30 (0.52) 0.29
Diluted earnings 1.80 1.07 0.30 (0.52) 0.28
Common stock dividends declared per share 0.66 0.60 0.60 0.60 0.50
Weighted-average Common Shares Outstanding
Basic earnings 153.0 155.7 156.0 154.0 154.0
Diluted earnings 154.4 156.7 156.3 154.0 155.6
Financial Condition
Cash, cash equivalents, and short-term investments $ 851 696 589 408 493
Merchandise inventories 1,069 1,059 1,037 1,120 1,281
Property and equipment, net 427 386 387 432 521
Total assets 3,050 2,896 2,816 2,877 3,243
Long-term debt 135 137 138 142 221
Total shareholders’ equity 2,110 2,025 1,948 1,924 2,261
Financial Ratios
Sales per average gross square foot
(1)
$ 406 360 333 350 352
Earnings before interest and taxes (EBIT)
(2)
441 266 83 (95) (49)
EBIT margin
(2)
7.8% 5.3 1.7 (1.8) (0.9)
Net income margin
(2)
4.9% 3.3 1.0 (1.5) 0.8
Return on assets (ROA) 9.4% 5.9 1.7 (2.6) 1.3
Net debt capitalization percent
(3)
36.0% 39.0 43.0 46.7 45.1
Current ratio 3.8 4.0 4.1 4.2 4.0
Other Data
Capital expenditures $ 152 97 89 146 148
Number of stores at year end 3,369 3,426 3,500 3,641 3,785
Total selling square footage at year end (in millions) 7.38 7.54 7.74 8.09 8.50
Total gross square footage at year end (in millions) 12.45 12.64 12.96 13.50 14.12
(1) Calculated as Athletic Store sales divided by the average monthly ending gross square footage of the last thirteen months.
(2) Calculated using results from continuing operations.
(3) Represents total debt, net of cash, cash equivalents, and short-term investments. Additionally, this calculation includes the
present value of operating leases, and accordingly is considered a non-GAAP measure.
13