Foot Locker 2011 Annual Report Download - page 78
Download and view the complete annual report
Please find page 78 of the 2011 Foot Locker annual report below. You can navigate through the pages in the report by either clicking on the pages listed below, or by using the keyword search tool below to find specific information within the annual report.-
 1
1 -
2
-
3
-
4
-
5
-
6
-
7
-
8
-
9
-
10
-
11
-
12
-
13
-
14
-
15
-
16
-
17
-
18
-
19
-
20
-
21
-
22
-
23
-
24
-
25
-
26
-
27
-
28
-
29
-
30
-
31
-
32
-
33
-
34
-
35
-
36
-
37
-
38
-
39
-
40
-
41
-
42
-
43
-
44
-
45
-
46
-
47
-
48
-
49
-
50
-
51
-
52
-
53
-
54
-
55
-
56
-
57
-
58
-
59
-
60
-
61
-
62
-
63
-
64
-
65
-
66
-
67
-
 68
68 -
 69
69 -
 70
70 -
 71
71 -
 72
72 -
 73
73 -
 74
74 -
 75
75 -
 76
76 -
 77
77 -
 78
78 -
 79
79 -
 80
80 -
 81
81 -
 82
82 -
 83
83 -
 84
84 -
 85
85 -
 86
86 -
 87
87 -
 88
88 -
89
-
90
-
91
-
92
-
93
-
94
-
95
-
96
-
97
-
98
-
99
-
100
-
101
-
102
-
103
-
104
-
105
-
106
-
107
-
108
 |
 |

FOOT LOCKER, INC.
NOTES TO CONSOLIDATED FINANCIAL STATEMENTS
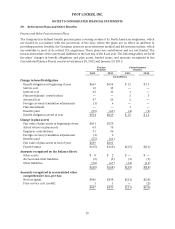
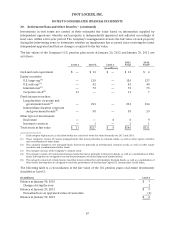
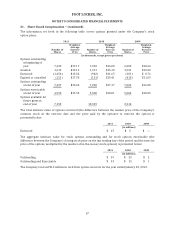
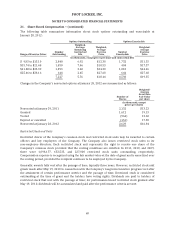
19. Fair Value Measurements
The following table provides a summary of the recognized assets and liabilities that are measured at fair
value on a recurring basis:
As of January 28, 2012 As of January 29, 2011
(in millions)
Level 1 Level 2 Level 3 Level 1 Level 2 Level 3
Assets
Auction rate security $ — $ 5 $ — $ — $ 5 $ —
Forward foreign
exchange
contracts — — — — 2 —
Total Assets $ — $ 5 $ — $ — $ 7 $ —
Liabilities
Forward foreign
exchange
contracts — 2 — — — —
Total Liabilities $ — $ 2 $ — $ — $ — $ —
The Company’s derivative financial instruments are valued using observable market-based inputs to
industry valuation models. These valuation models require a variety of inputs, including contractual terms,
market prices, yield curves, and measures of volatility obtained from various market sources.
At January 28, 2012 and January 29, 2011, the Company held a preferred stock auction rate security with a
face value of $7 million. The security earns and pays interest based on the stated terms. The Company
classifies the security as long-term available-for-sale and reports the security at fair value as a component
of other assets on the Company’s Consolidated Balance Sheets. The Company evaluates the security for
other-than-temporary impairments at each reporting period. The security is considered temporarily
impaired at January 28, 2012 with a cumulative unrealized loss of $2 million reflected in accumulated
other comprehensive loss in the Company’s Consolidated Statement of Comprehensive Loss. The Company
has the intent and the ability to hold the security.
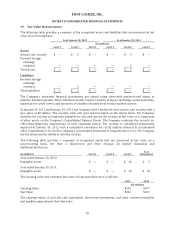
The following table provides a summary of recognized assets that are measured at fair value on a
non-recurring basis. See Note 3, Impairment and Other Charges, for further discussion and
additional disclosures.
(in millions) Level 1 Level 2 Level 3
Loss
Recognized
Year ended January 28, 2012:
Intangible assets $ — $ — $ 10 $ 5
Year ended January 29, 2011:
Intangible assets $ — $ — $ 15 $ 10
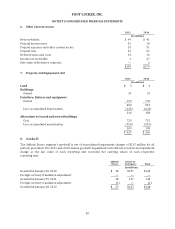
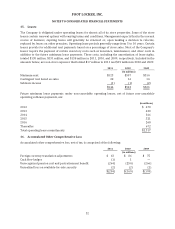
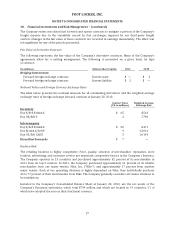
The carrying value and estimated fair value of long-term debt were as follows:
2011 2010
(in millions)
Carrying Value $135 $137
Fair Value $140 $139
The carrying values of cash and cash equivalents, short-term investments, and other current receivables
and payables approximate their fair value.
58