Foot Locker 2011 Annual Report Download - page 83
Download and view the complete annual report
Please find page 83 of the 2011 Foot Locker annual report below. You can navigate through the pages in the report by either clicking on the pages listed below, or by using the keyword search tool below to find specific information within the annual report.-
 1
1 -
2
-
3
-
4
-
5
-
6
-
7
-
8
-
9
-
10
-
11
-
12
-
13
-
14
-
15
-
16
-
17
-
18
-
19
-
20
-
21
-
22
-
23
-
24
-
25
-
26
-
27
-
28
-
29
-
30
-
31
-
32
-
33
-
34
-
35
-
36
-
37
-
38
-
39
-
40
-
41
-
42
-
43
-
44
-
45
-
46
-
47
-
48
-
49
-
50
-
51
-
52
-
53
-
54
-
55
-
56
-
57
-
58
-
59
-
60
-
61
-
62
-
63
-
64
-
65
-
66
-
67
-
68
-
69
-
70
-
71
-
72
-
 73
73 -
 74
74 -
 75
75 -
 76
76 -
 77
77 -
 78
78 -
 79
79 -
 80
80 -
 81
81 -
 82
82 -
 83
83 -
 84
84 -
 85
85 -
 86
86 -
 87
87 -
 88
88 -
 89
89 -
 90
90 -
 91
91 -
 92
92 -
 93
93 -
94
-
95
-
96
-
97
-
98
-
99
-
100
-
101
-
102
-
103
-
104
-
105
-
106
-
107
-
108
 |
 |

FOOT LOCKER, INC.
NOTES TO CONSOLIDATED FINANCIAL STATEMENTS
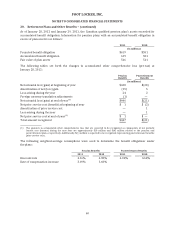
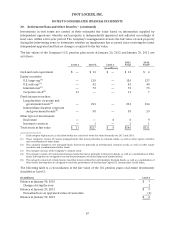
20. Retirement Plans and Other Benefits − (continued)
Investments in real estate are carried at their estimated fair value based on information supplied by
independent appraisers whereby each property is independently appraised and adjusted accordingly at
least once within a five-year period. The Company’s management reviews the fair value of each property
during the intervening years to determine whether an impairment has occurred since receiving the latest
independent appraisal and that no change is required to the fair value.
The fair values of the Company’s U.S. pension plan assets at January 28, 2012 and January 29, 2011 are
as follows:
Level 1 Level 2 Level 3
2011
Total
2010
Total*
(in millions)
Cash and cash equivalents $ — $ 13 $ — $ 13 $ 4
Equity securities:
U.S. large-cap
(1)
— 120 — 120 137
U.S. mid-cap
(1)
— 42 — 42 40
International
(2)
— 72 — 72 70
Corporate stock
(3)
11 — — 11 7
Fixed-income securities:
Long duration corporate and
government bonds
(4)
— 221 — 221 214
Intermediate duration corporate
and government bonds
(5)
— 58 — 58 29
Other types of investments:
Real estate — — 8 8 9
Insurance contracts — 1 — 1 1
Total assets at fair value $ 11 $527 $ 8 $546 $511
* Each category of plan assets is classified within the same level of the fair value hierarchy for 2011 and 2010.
(1) These categories consist of various managed funds that invest primarily in common stocks, as well as other equity securities
and a combination of other funds.
(2) This category comprises two managed funds that invest primarily in international common stocks, as well as other equity
securities and a combination of other funds.
(3) This category consists of the Company’s common stock.
(4) This category consists of various fixed-income funds that invest primarily in long-term bonds, as well as a combination of other
funds, that together are designed to exceed the performance of related long-term market indices.
(5) This category consists of a fixed-income fund that invests primarily in intermediate duration bonds, as well as a combination of
other funds, that together are designed to track the performance of the Barclays Capital U.S. Intermediate Credit Index.
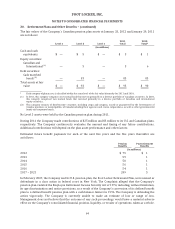
The following table is a reconciliation of the fair value of the U.S. pension plan’s real estate investments
classified as Level 3:
(in millions) Level 3
Balance at January 30, 2010 $ 7
Changes during the year 2
Balance at January 29, 2011 $ 9
Unrealized loss on appraised value of real estate (1)
Balance at January 28, 2012 $ 8
63