Foot Locker 2011 Annual Report Download - page 43
Download and view the complete annual report
Please find page 43 of the 2011 Foot Locker annual report below. You can navigate through the pages in the report by either clicking on the pages listed below, or by using the keyword search tool below to find specific information within the annual report.-
 1
1 -
2
-
3
-
4
-
5
-
6
-
7
-
8
-
9
-
10
-
11
-
12
-
13
-
14
-
15
-
16
-
17
-
18
-
19
-
20
-
21
-
22
-
23
-
24
-
25
-
26
-
27
-
28
-
29
-
30
-
31
-
32
-
 33
33 -
 34
34 -
 35
35 -
 36
36 -
 37
37 -
 38
38 -
 39
39 -
 40
40 -
 41
41 -
 42
42 -
 43
43 -
 44
44 -
 45
45 -
 46
46 -
 47
47 -
 48
48 -
 49
49 -
 50
50 -
 51
51 -
 52
52 -
 53
53 -
54
-
55
-
56
-
57
-
58
-
59
-
60
-
61
-
62
-
63
-
64
-
65
-
66
-
67
-
68
-
69
-
70
-
71
-
72
-
73
-
74
-
75
-
76
-
77
-
78
-
79
-
80
-
81
-
82
-
83
-
84
-
85
-
86
-
87
-
88
-
89
-
90
-
91
-
92
-
93
-
94
-
95
-
96
-
97
-
98
-
99
-
100
-
101
-
102
-
103
-
104
-
105
-
106
-
107
-
108
 |
 |

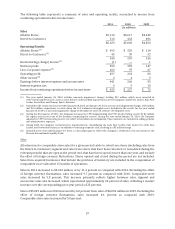
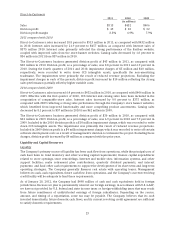
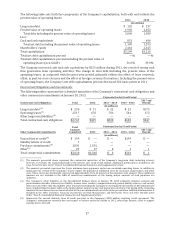
Direct-to-Customers
2011 2010 2009
(in millions)
Sales $513 $432 $406
Division profit $ 45 $ 30 $ 32
Division profit margin 8.8% 6.9% 7.9%
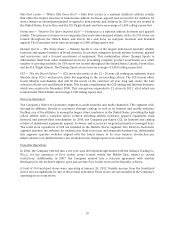
2011 compared with 2010
Direct-to-Customers sales increased 18.8 percent to $513 million in 2011, as compared with $432 million
in 2010. Internet sales increased by 21.9 percent to $457 million, as compared with Internet sales of
$375 million 2010. Internet sales primarily reflected the strong performance of the Eastbay website,
coupled with improved sales from the store-banner websites. Catalog sales decreased by 1.8 percent to
$56 million in 2011 from $57 million in 2010.
The Direct-to-Customers business generated division profit of $45 million in 2011, as compared with
$30 million in 2010. Division profit, as a percentage of sales, was 8.8 percent in 2011 and 6.9 percent in
2010. During the fourth quarters of 2011 and 2010, impairment charges of $5 million and $10 million,
respectively, were recorded to write down CCS intangible assets, specifically the non-amortizing
tradename. The impairments were primarily the result of reduced revenue projections. Excluding the
impairment charges in each of the periods, division profit increased by $10 million reflecting the strong
sales performance, partially offset by higher variable costs.
2010 compared with 2009
Direct-to-Customers sales increased 6.4 percent to $432 million in 2010, as compared with $406 million in
2009. Effective with the first quarter of 2010, CCS Internet and catalog sales have been included in the
computation of comparable-store sales. Internet sales increased by 9.0 percent to $375 million, as
compared with 2009 reflecting a strong sales performance through the Company’s store banner websites,
which benefited from improved functionality and more compelling product assortments. Catalog sales
decreased by 8.1 percent to $57 million in 2010 from $62 million in 2009.
The Direct-to-Customers business generated division profit of $30 million in 2010, as compared with
$32 million in 2009. Division profit, as a percentage of sales, was 6.9 percent in 2010 and 7.9 percent in
2009. Included in the 2010 division profit is a $10 million impairment charge, which was recorded to write
down CCS intangible assets. The impairment was primarily the result of reduced revenue projections.
Included in 2009 division profit is a $4 million impairment charge, which was recorded to write off certain
software development costs as a result of management’s decision to terminate the project. Excluding these
charges, division profit increased by $4 million as compared with the prior year.
Liquidity and Capital Resources
Liquidity
The Company’s primary source of liquidity has been cash flow from operations, while the principal uses of
cash have been to: fund inventory and other working capital requirements; finance capital expenditures
related to store openings, store remodelings, Internet and mobile sites, information systems, and other
support facilities; make retirement plan contributions, quarterly dividend payments, and interest
payments; and fund other cash requirements to support the development of its short-term and long-term
operating strategies. The Company generally finances real estate with operating leases. Management
believes its cash, cash equivalents, future cash flow from operations, and the Company’s current revolving
credit facility will be adequate to fund these requirements.
As of January 28, 2012, the Company had $498 million of cash and cash equivalents held in foreign
jurisdictions. Because we plan to permanently reinvest our foreign earnings, in accordance with U.S. GAAP,
we have not provided for U.S. federal and state income taxes or foreign withholding taxes that may result
from future remittances of undistributed earnings of foreign subsidiaries. Depending on the source,
amount, and timing of a repatriation, some tax may be payable. The Company believes that its cash
invested domestically, future domestic cash flows, and its current revolving credit agreement are sufficient
to satisfy domestic requirements.
23