Foot Locker 2011 Annual Report Download - page 36
Download and view the complete annual report
Please find page 36 of the 2011 Foot Locker annual report below. You can navigate through the pages in the report by either clicking on the pages listed below, or by using the keyword search tool below to find specific information within the annual report.-
 1
1 -
2
-
3
-
4
-
5
-
6
-
7
-
8
-
9
-
10
-
11
-
12
-
13
-
14
-
15
-
16
-
17
-
18
-
19
-
20
-
21
-
22
-
23
-
24
-
25
-
 26
26 -
 27
27 -
 28
28 -
 29
29 -
 30
30 -
 31
31 -
 32
32 -
 33
33 -
 34
34 -
 35
35 -
 36
36 -
 37
37 -
 38
38 -
 39
39 -
 40
40 -
 41
41 -
 42
42 -
 43
43 -
 44
44 -
 45
45 -
 46
46 -
47
-
48
-
49
-
50
-
51
-
52
-
53
-
54
-
55
-
56
-
57
-
58
-
59
-
60
-
61
-
62
-
63
-
64
-
65
-
66
-
67
-
68
-
69
-
70
-
71
-
72
-
73
-
74
-
75
-
76
-
77
-
78
-
79
-
80
-
81
-
82
-
83
-
84
-
85
-
86
-
87
-
88
-
89
-
90
-
91
-
92
-
93
-
94
-
95
-
96
-
97
-
98
-
99
-
100
-
101
-
102
-
103
-
104
-
105
-
106
-
107
-
108
 |
 |

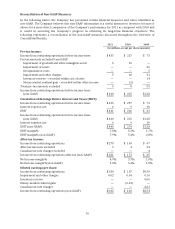
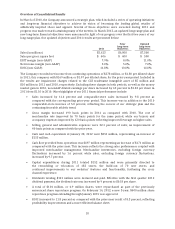
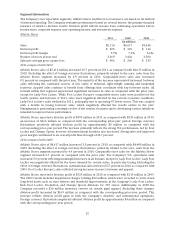
Reconciliation of Non-GAAP Measures
In the following tables, the Company has presented certain financial measures and ratios identified as
non-GAAP. The Company believes this non-GAAP information is a useful measure to investors because it
allows for a more direct comparison of the Company’s performance for 2011 as compared with 2010 and
is useful in assessing the Company’s progress in achieving its long-term financial objectives. The
following represents a reconciliation of the non-GAAP measures discussed throughout the Overview of
Consolidated Results:
2011 2010 2009
(in millions, except per share amounts)
Pre-tax income:
Income from continuing operations before income taxes $ 435 $ 257 $ 73
Pre-tax amounts excluded from GAAP:
Impairment of goodwill and other intangible assets 5 10 —
Impairment of assets — — 36
Reorganization costs — — 5
Impairment and other charges 5 10 41
Inventory reserve − recorded within cost of sales — — 14
Money market realized gain − recorded within other income — (2) —
Total pre-tax amounts excluded 5 8 55
Income from continuing operations before income taxes
(non-GAAP) $ 440 $ 265 $ 128
Calculation of Earnings Before Interest and Taxes (EBIT):
Income from continuing operations before income taxes $ 435 $ 257 $ 73
Interest expense, net 6 9 10
EBIT $ 441 $ 266 $ 83
Income from continuing operations before income taxes
(non-GAAP) $ 440 $ 265 $ 128
Interest expense, net 6 9 10
EBIT (non-GAAP) $ 446 $ 274 $ 138
EBIT margin% 7.8% 5.3% 1.7%
EBIT margin% (non-GAAP) 7.9% 5.4% 2.8%
After-tax income:
Income from continuing operations $ 278 $ 169 $ 47
After-tax amounts excluded 3 4 34
Canadian tax rate changes excluded — — 4
Income from continuing operations after-tax (non-GAAP) $ 281 $ 173 $ 85
Net income margin% 4.9% 3.3% 1.0%
Net income margin% (non-GAAP) 5.0% 3.4% 1.8%
Diluted earnings per share:
Income from continuing operations $1.80 $ 1.07 $0.30
Impairment and other charges 0.02 0.04 0.16
Inventory reserve — — 0.06
Money-market realized gain — (0.01) —
Canadian tax rate changes — — 0.02
Income from continuing operations (non-GAAP) $1.82 $ 1.10 $0.54
16