Foot Locker 2011 Annual Report Download - page 38
Download and view the complete annual report
Please find page 38 of the 2011 Foot Locker annual report below. You can navigate through the pages in the report by either clicking on the pages listed below, or by using the keyword search tool below to find specific information within the annual report.-
 1
1 -
2
-
3
-
4
-
5
-
6
-
7
-
8
-
9
-
10
-
11
-
12
-
13
-
14
-
15
-
16
-
17
-
18
-
19
-
20
-
21
-
22
-
23
-
24
-
25
-
26
-
27
-
 28
28 -
 29
29 -
 30
30 -
 31
31 -
 32
32 -
 33
33 -
 34
34 -
 35
35 -
 36
36 -
 37
37 -
 38
38 -
 39
39 -
 40
40 -
 41
41 -
 42
42 -
 43
43 -
 44
44 -
 45
45 -
 46
46 -
 47
47 -
 48
48 -
49
-
50
-
51
-
52
-
53
-
54
-
55
-
56
-
57
-
58
-
59
-
60
-
61
-
62
-
63
-
64
-
65
-
66
-
67
-
68
-
69
-
70
-
71
-
72
-
73
-
74
-
75
-
76
-
77
-
78
-
79
-
80
-
81
-
82
-
83
-
84
-
85
-
86
-
87
-
88
-
89
-
90
-
91
-
92
-
93
-
94
-
95
-
96
-
97
-
98
-
99
-
100
-
101
-
102
-
103
-
104
-
105
-
106
-
107
-
108
 |
 |

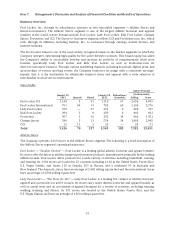
Overview of Consolidated Results
In March of 2010, the Company announced a strategic plan, which included a series of operating initiatives
and long-term financial objectives to achieve its vision of becoming the leading global retailer of
athletically inspired shoes and apparel. Several of those objectives were exceeded during 2011 and
progress was made towards attaining many of the metrics. In March 2012, an updated long-range plan and
new long-term financial objectives were announced in light of our progress over the first two years of our
long-range plan. Our updated objectives and 2011 results are presented below:
2011
Prior
Long-term
Objectives
Updated
Long-term
Objectives
Sales (in millions) $5,623 $6,000 $7,500
Sales per gross square foot $ 406 $ 400 $ 500
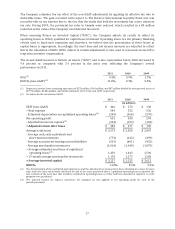
EBIT margin (non-GAAP) 7.9% 8.0% 11.0%
Net income margin (non-GAAP) 5.0% 5.0% 7.0%
ROIC (non-GAAP) 11.8% 10.0% 14.0%
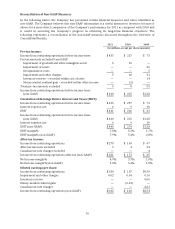
The Company recorded net income from continuing operations of $278 million, or $1.80 per diluted share
in 2011; this compares with $169 million, or $1.07 per diluted share, for the prior-year period. Included in
the results are impairment charges related to the CCS tradename intangible asset of $5 million and
$10 million in 2011 and 2010, respectively. Excluding these charges in both periods, as well as the money
market gain in 2010, non-GAAP diluted earnings per share increased by 65 percent to $1.82 per share in
2011 from $1.10 in 2010. Other highlights of our 2011 financial performance include:
• Sales increased by 11.4 percent and comparable-store sales increased by 9.8 percent as
compared with the corresponding prior-year period. This increase was in addition to the 2010
comparable-store increase of 5.8 percent, reflecting the success of our strategic plan and the
continuing favorable athletic trend.
• Gross margin increased 190 basis points in 2011 as compared with 2010. The cost of
merchandise rate improved by 70 basis points for the same period, while our buyers and
occupancy expenses improved by 120 basis points reflecting improved leverage on higher sales.
• Selling, general and administrative expenses were 22.1 percent of sales, an improvement of
40 basis points as compared with the prior year.
• Cash and cash equivalents at January 28, 2012 were $851 million, representing an increase of
$155 million.
• Cash flow provided from operations was $497 million representing an increase of $171 million as
compared with the prior year. This increase reflects the strong sales performance coupled with
improved merchandise management. Merchandise inventories, excluding foreign currency
fluctuations increased by 1.6 percent while sales, excluding foreign currency fluctuations,
increased by 9.7 percent.
• Capital expenditures during 2011 totaled $152 million and were primarily directed to
the remodeling or relocation of 182 stores, the build-out of 70 new stores, and
continued improvements to our websites’ features and functionality, furthering the cross
channel experience.
• Dividends totaling $101 million were declared and paid. Effective with the first quarter 2012
dividend payment, the dividend rate was increased by 9 percent to $0.18 per share.
• A total of $104 million, or 4.9 million shares, were repurchased as part of the previously
announced share repurchase program. On February 14, 2012, a new 3-year, $400 million share
repurchase program extending through January 2015 was approved.
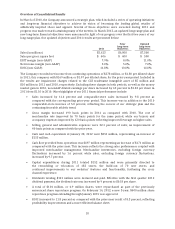
• ROIC increased to 11.8 percent as compared with the prior-year result of 8.3 percent, reflecting
profitability improvements and a more efficient balance sheet.
18