Foot Locker 2011 Annual Report Download - page 40
Download and view the complete annual report
Please find page 40 of the 2011 Foot Locker annual report below. You can navigate through the pages in the report by either clicking on the pages listed below, or by using the keyword search tool below to find specific information within the annual report.-
 1
1 -
2
-
3
-
4
-
5
-
6
-
7
-
8
-
9
-
10
-
11
-
12
-
13
-
14
-
15
-
16
-
17
-
18
-
19
-
20
-
21
-
22
-
23
-
24
-
25
-
26
-
27
-
28
-
29
-
 30
30 -
 31
31 -
 32
32 -
 33
33 -
 34
34 -
 35
35 -
 36
36 -
 37
37 -
 38
38 -
 39
39 -
 40
40 -
 41
41 -
 42
42 -
 43
43 -
 44
44 -
 45
45 -
 46
46 -
 47
47 -
 48
48 -
 49
49 -
 50
50 -
51
-
52
-
53
-
54
-
55
-
56
-
57
-
58
-
59
-
60
-
61
-
62
-
63
-
64
-
65
-
66
-
67
-
68
-
69
-
70
-
71
-
72
-
73
-
74
-
75
-
76
-
77
-
78
-
79
-
80
-
81
-
82
-
83
-
84
-
85
-
86
-
87
-
88
-
89
-
90
-
91
-
92
-
93
-
94
-
95
-
96
-
97
-
98
-
99
-
100
-
101
-
102
-
103
-
104
-
105
-
106
-
107
-
108
 |
 |

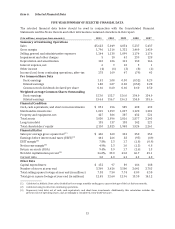
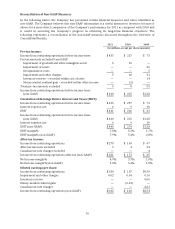
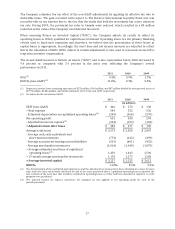
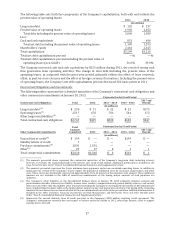
Gross Margin
Gross margin as a percentage of sales was 31.9 percent in 2011, increasing by 190 basis points as
compared with 2010. This increase reflected a 70 basis points improvement in the merchandise margin
rate, which is attributable to an improved inventory position, better merchandise flow, and lower
markdowns as the Company was less promotional during 2011. The effect of vendor allowances, as
compared with the prior year, contributed 10 basis points to this improvement. The increase in the gross
margin rate also included a decrease of 120 basis points in the occupancy and buyers salary expense rate
reflecting improved leverage on largely fixed costs.
Gross margin as a percentage of sales was 30.0 percent in 2010 increasing 260 basis points as compared
with 2009. In 2009, the Company recorded a $14 million inventory reserve on certain aged apparel as part
of its new apparel strategy. Excluding this charge, gross margin would have increased by 230 basis points
as compared with 2009. This increase reflected an increase of 150 basis points in the merchandise margin
rate reflecting lower markdowns as the Company was less promotional during the year as compared with
the prior year. Lower vendor allowances during the current year, reflecting the overall lower promotional
activity, negatively affected gross margin by 10 basis points. The increase in the gross margin also reflected
a decrease of 80 basis points in the occupancy and buyers salary expense rate due to improved leverage
and expense reductions.
Selling, General and Administrative Expenses
Selling, general and administrative (‘‘SG&A’’) expenses increased by $106 million to $1,244 million in
2011, or by 9.3 percent, as compared with 2010. SG&A as a percentage of sales decreased to 22.1 percent
as compared with 22.5 percent in 2010. Excluding the effect of foreign currency fluctuations in 2011, SG&A
increased by $86 million. This increase primarily reflects higher variable expenses to support sales, such as
store wages and banking expenses. Also during 2011, the Company increased its marketing and
advertising spending by $25 million in order to support the Company’s strategic objective of
differentiating its formats.
SG&A expenses increased by $39 million to $1,138 million in 2010, or by 3.5 percent, as compared with
2009. SG&A as a percentage of sales decreased to 22.5 percent as compared with 22.6 percent in 2009, due
to expense management and the increase in sales. Excluding the effect of foreign currency fluctuations in
2010, SG&A increased by $47 million. This increase primarily reflects higher incentive compensation costs
totaling $45 million, partially offset by expense management efforts.
Corporate Expense
Corporate expense consists of unallocated general and administrative expenses as well as depreciation and
amortization related to the Company’s corporate headquarters, centrally managed departments,
unallocated insurance and benefit programs, certain foreign exchange transaction gains and losses, and
other items. Depreciation and amortization included in corporate expense was $11 million, $12 million,
and $13 million in 2011, 2010, and 2009, respectively.
Corporate expense increased by $5 million to $102 million in 2011 as compared with 2010. The increase
represents primarily higher share-based compensation expense and miscellaneous professional fees.
Corporate expense increased by $30 million to $97 million in 2010 as compared with 2009. Incentive
compensation costs represented an increase of $29 million as a result of the Company’s outperformance as
compared with plan. Additionally, 2009 included a $5 million charge related to the reorganization of its
operations and corporate staff reductions.
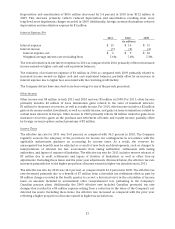
Depreciation and Amortization
Depreciation and amortization of $110 million increased by 3.8 percent in 2011 from $106 million in 2010.
Foreign currency fluctuations increased depreciation and amortization expense by $2 million.
20