Experian 2013 Annual Report Download - page 48
Download and view the complete annual report
Please find page 48 of the 2013 Experian annual report below. You can navigate through the pages in the report by either clicking on the pages listed below, or by using the keyword search tool below to find specific information within the annual report.-
 1
1 -
2
-
3
-
4
-
5
-
6
-
7
-
8
-
9
-
10
-
11
-
12
-
13
-
14
-
15
-
16
-
17
-
18
-
19
-
20
-
21
-
22
-
23
-
24
-
25
-
26
-
27
-
28
-
29
-
30
-
31
-
32
-
33
-
34
-
35
-
36
-
37
-
 38
38 -
 39
39 -
 40
40 -
 41
41 -
 42
42 -
 43
43 -
 44
44 -
 45
45 -
 46
46 -
 47
47 -
 48
48 -
 49
49 -
 50
50 -
 51
51 -
 52
52 -
 53
53 -
 54
54 -
 55
55 -
 56
56 -
 57
57 -
 58
58 -
59
-
60
-
61
-
62
-
63
-
64
-
65
-
66
-
67
-
68
-
69
-
70
-
71
-
72
-
73
-
74
-
75
-
76
-
77
-
78
-
79
-
80
-
81
-
82
-
83
-
84
-
85
-
86
-
87
-
88
-
89
-
90
-
91
-
92
-
93
-
94
-
95
-
96
-
97
-
98
-
99
-
100
-
101
-
102
-
103
-
104
-
105
-
106
-
107
-
108
-
109
-
110
-
111
-
112
-
113
-
114
-
115
-
116
-
117
-
118
-
119
-
120
-
121
-
122
-
123
-
124
-
125
-
126
-
127
-
128
-
129
-
130
-
131
-
132
-
133
-
134
-
135
-
136
-
137
-
138
-
139
-
140
-
141
-
142
-
143
-
144
-
145
-
146
-
147
-
148
-
149
-
150
-
151
-
152
-
153
-
154
-
155
-
156
-
157
-
158
-
159
-
160
-
161
-
162
-
163
-
164
-
165
-
166
-
167
-
168
-
169
-
170
-
171
-
172
-
173
-
174
-
175
-
176
 |
 |

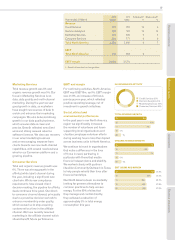
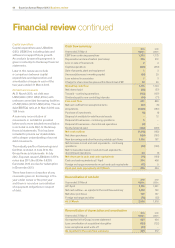
Capital expenditure
Capital expenditure was US$460m
(2012: US$453m) including data and
software to support future growth.
An analysis by operating segment is
given in note 9(a) to the Group financial
statements.
Later in this review we include
a comparison between capital
expenditure and depreciation and
amortisation charges in each of the
two years ended 31 March 2013.
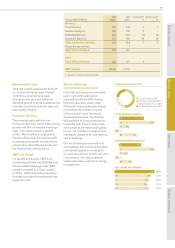
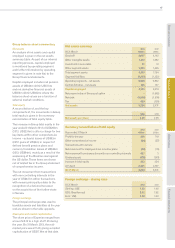
Net debt and covenants
At 31 March 2013, net debt was
US$2,938m (2012: US$1,818m) with
undrawn committed borrowing facilities
of US$1,624m (2012: US$2,147m). The net
debt/EBITDA ratio at 31 March 2013 was
1.86 times.
A summary reconciliation of
movements in net debt is provided
below and a more detailed reconciliation
is included in note 30(c) to the Group
financial statements. This has been
included to provide our stakeholders
with a deeper understanding of our net
debt movements.
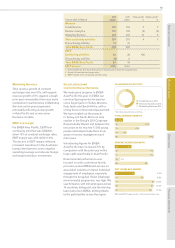
The maturity profile of borrowings and
facilities is shown in note 29 to the
Group financial statements. In July
2012, Experian issued US$600m 2.375%
notes due 2017; the £334m 5.625%
Euronotes 2013 are due for redemption
in December 2013.
There have been no breaches of any
covenants given on borrowings in the
year under review or the prior year
and there is no undue concentration
of repayment obligations in respect
of debt.
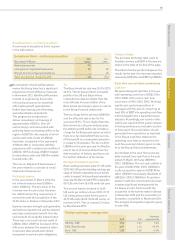
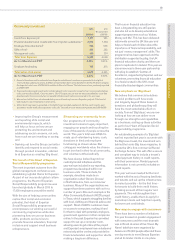
Reconciliation of depreciation and amortisation
Year ended 31 March
2013
US$m
2012
US$m
As reported in the Group income statement 465 434
Less: amortisation of acquisition intangibles (123) (122)
Less: exceptional asset write-off (13) –
As reported in the cash flow summary 329 312
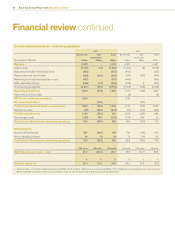
Cash flow summary
Year ended 31 March
2013
US$m
2012
US$m
EBIT from continuing operations 1,253 1,175
Depreciation and amortisation (see below) 329 312
Loss on sale of fixed assets 24
Capital expenditure (460) (453)
Sale of property, plant and equipment 13
(Increase)/decrease in working capital (29) 20
Loss retained in associates 13
Charge for share incentive plans within Benchmark PBT 78 60
Operating cash flow 1,175 1,124
Net interest paid (68) (57)
Tax paid – continuing operations (162) (107)
Dividends paid to non-controlling interests (54) (71)
Free cash flow 891 889
Net cash outflow from exceptional items (27) (5)
Acquisitions (1,549) (787)
Purchase of investments (8) (1)
Disposal of available-for-sale financial assets –12
Disposal of businesses – continuing operations 5–
Disposal of businesses – discontinued operations (8) –
Equity dividends paid (322) (290)
Net cash outflow (1,018) (182)
Net share purchases (180) (167)
New borrowings and other financing related cash flows 1,118 187
Net decrease in cash and cash equivalents – continuing
operations (80) (162)
Net increase/(decrease) in cash and cash equivalents –
discontinued operations 64 (1)
Net decrease in cash and cash equivalents (16) (163)
Cash and cash equivalents at 1 April 254 408
Foreign exchange movements on cash and cash equivalents (12) 9
Cash and cash equivalents at 31 March 226 254
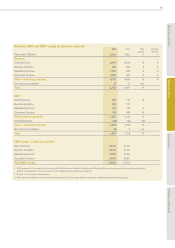
Reconciliation of net debt
Year ended 31 March
2013
US$m
2012
US$m
At 1 April 1,818 1,501
Net cash outflow – as reported in the cash flow summary 1,018 182
Net share purchases 180 167
Foreign exchange and other (78) (32)
At 31 March 2,938 1,818
Financial review continued
46 Experian Annual Report 2013 Business review