Experian 2013 Annual Report Download - page 137
Download and view the complete annual report
Please find page 137 of the 2013 Experian annual report below. You can navigate through the pages in the report by either clicking on the pages listed below, or by using the keyword search tool below to find specific information within the annual report.-
 1
1 -
2
-
3
-
4
-
5
-
6
-
7
-
8
-
9
-
10
-
11
-
12
-
13
-
14
-
15
-
16
-
17
-
18
-
19
-
20
-
21
-
22
-
23
-
24
-
25
-
26
-
27
-
28
-
29
-
30
-
31
-
32
-
33
-
34
-
35
-
36
-
37
-
38
-
39
-
40
-
41
-
42
-
43
-
44
-
45
-
46
-
47
-
48
-
49
-
50
-
51
-
52
-
53
-
54
-
55
-
56
-
57
-
58
-
59
-
60
-
61
-
62
-
63
-
64
-
65
-
66
-
67
-
68
-
69
-
70
-
71
-
72
-
73
-
74
-
75
-
76
-
77
-
78
-
79
-
80
-
81
-
82
-
83
-
84
-
85
-
86
-
87
-
88
-
89
-
90
-
91
-
92
-
93
-
94
-
95
-
96
-
97
-
98
-
99
-
100
-
101
-
102
-
103
-
104
-
105
-
106
-
107
-
108
-
109
-
110
-
111
-
112
-
113
-
114
-
115
-
116
-
117
-
118
-
119
-
120
-
121
-
122
-
123
-
124
-
125
-
126
-
 127
127 -
 128
128 -
 129
129 -
 130
130 -
 131
131 -
 132
132 -
 133
133 -
 134
134 -
 135
135 -
 136
136 -
 137
137 -
 138
138 -
 139
139 -
 140
140 -
 141
141 -
 142
142 -
 143
143 -
 144
144 -
 145
145 -
 146
146 -
 147
147 -
148
-
149
-
150
-
151
-
152
-
153
-
154
-
155
-
156
-
157
-
158
-
159
-
160
-
161
-
162
-
163
-
164
-
165
-
166
-
167
-
168
-
169
-
170
-
171
-
172
-
173
-
174
-
175
-
176
 |
 |
135
Business review Business overview Governance Financial statements
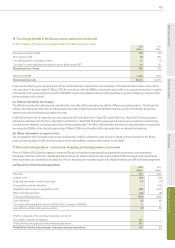
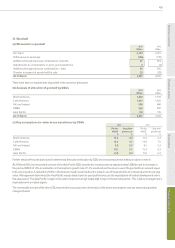
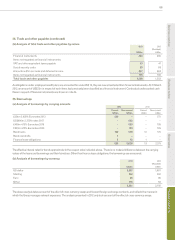
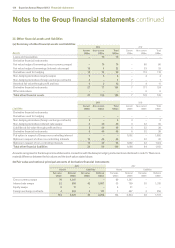
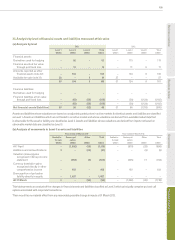
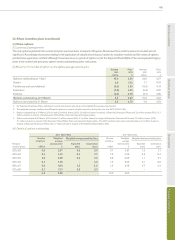
28. Trade and other payables (continued)
(b) Analysis of total trade and other payables by nature
2013
US$m
2012
(Restated)
US$m
Financial instruments 463 465
Items not regarded as financial instruments:
VAT and other equivalent taxes payable 43 41
Social security costs 85 85
Amounts within accruals and deferred income 647 662
Items not regarded as financial instruments 775 788
Total trade and other payables 1,238 1,253
As obligations under employee benefit plans are accounted for under IAS 19, they are now all excluded from financial instruments. At 31 March
2012, an amount of US$72m in respect of such items had previously been classified as a financial instrument. Contractual undiscounted cash
flows in respect of financial instruments are shown in note 34.
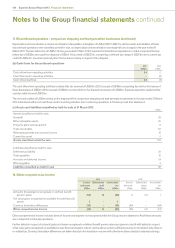
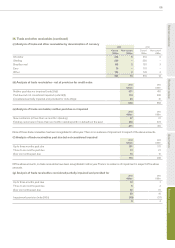
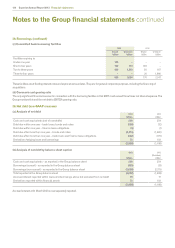
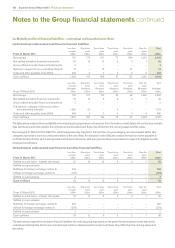
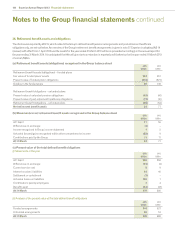
29. Borrowings
(a) Analysis of borrowings by carrying amounts
2013 2012
Current
US$m
Non-current
US$m
Current
US$m
Non-current
US$m
£334m 5.625% Euronotes 2013 529 – – 571
US$600m 2.375% notes 2017 – 602 – –
£400m 4.75% Euronotes 2018 – 693 – 709
€500m 4.75% Euronotes 2020 – 729 – 729
Bank loans 100 590 12 170
Bank overdrafts 3–––
Finance lease obligations 3 12 1 –
635 2,626 13 2,179
The effective interest rates for bonds approximate to the coupon rates indicated above. There is no material difference between the carrying
values of the loans and borrowings and their fair values. Other than finance lease obligations, the borrowings are unsecured.
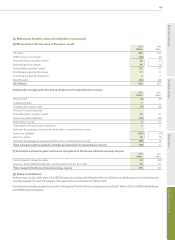
(b) Analysis of borrowings by currency
2013
US$m
2012
(Restated)
US$m
US dollar 2,557 1,657
Sterling 542 392
Euro 46 85
Other 116 58
3,261 2,192
The above analysis takes account of the effect of cross currency swaps and forward foreign exchange contracts, and reflects the manner in
which the Group manages relevant exposures. The analysis presented in 2012 only took account of the effect of cross currency swaps.