Experian 2013 Annual Report Download - page 121
Download and view the complete annual report
Please find page 121 of the 2013 Experian annual report below. You can navigate through the pages in the report by either clicking on the pages listed below, or by using the keyword search tool below to find specific information within the annual report.-
 1
1 -
2
-
3
-
4
-
5
-
6
-
7
-
8
-
9
-
10
-
11
-
12
-
13
-
14
-
15
-
16
-
17
-
18
-
19
-
20
-
21
-
22
-
23
-
24
-
25
-
26
-
27
-
28
-
29
-
30
-
31
-
32
-
33
-
34
-
35
-
36
-
37
-
38
-
39
-
40
-
41
-
42
-
43
-
44
-
45
-
46
-
47
-
48
-
49
-
50
-
51
-
52
-
53
-
54
-
55
-
56
-
57
-
58
-
59
-
60
-
61
-
62
-
63
-
64
-
65
-
66
-
67
-
68
-
69
-
70
-
71
-
72
-
73
-
74
-
75
-
76
-
77
-
78
-
79
-
80
-
81
-
82
-
83
-
84
-
85
-
86
-
87
-
88
-
89
-
90
-
91
-
92
-
93
-
94
-
95
-
96
-
97
-
98
-
99
-
100
-
101
-
102
-
103
-
104
-
105
-
106
-
107
-
108
-
109
-
110
-
 111
111 -
 112
112 -
 113
113 -
 114
114 -
 115
115 -
 116
116 -
 117
117 -
 118
118 -
 119
119 -
 120
120 -
 121
121 -
 122
122 -
 123
123 -
 124
124 -
 125
125 -
 126
126 -
 127
127 -
 128
128 -
 129
129 -
 130
130 -
 131
131 -
132
-
133
-
134
-
135
-
136
-
137
-
138
-
139
-
140
-
141
-
142
-
143
-
144
-
145
-
146
-
147
-
148
-
149
-
150
-
151
-
152
-
153
-
154
-
155
-
156
-
157
-
158
-
159
-
160
-
161
-
162
-
163
-
164
-
165
-
166
-
167
-
168
-
169
-
170
-
171
-
172
-
173
-
174
-
175
-
176
 |
 |
119
Business review Business overview Governance Financial statements
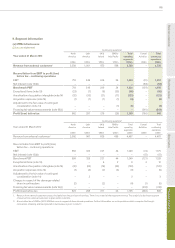
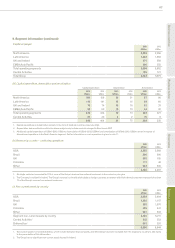
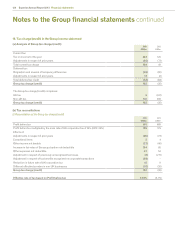
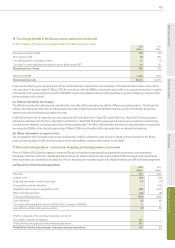
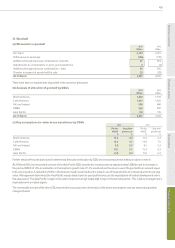
10. Foreign currency
(a) Principal exchange rates used
Average Closing
2013 2012 2013 2012 2011
Sterling : US dollar 1.58 1.60 1.52 1.60 1.60
US dollar : Brazilian real 2.01 1.70 2.02 1.82 1.63
Euro : US dollar 1.29 1.38 1.28 1.33 1.42
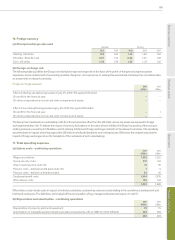
(b) Foreign exchange risk
The following table quantifies the Group’s sensitivity to foreign exchange risk on the basis of the profile of foreign exchange transaction
exposures, and an assessment of reasonably possible changes in such exposures. In making this assessment, the Group has considered data
on movements in relevant currencies.
Foreign exchange exposure
2013
US$m
2012
US$m
Effect of sterling strengthening/weakening by 3% (2012: 9%) against US dollar:
On profit for the financial year – –
On other comprehensive income and other components of equity – –
Effect of euro strengthening/weakening by 6% (2012: 8%) against US dollar:
On profit for the financial year – 1
On other comprehensive income and other components of equity – –
The Group has investments in undertakings with functional currencies other than the US dollar, whose net assets are exposed to foreign
exchange translation risk. To reduce the impact of currency fluctuations on the value of such entities, the Group has a policy of borrowing in
sterling and euros, as well as in US dollars, and of entering into forward foreign exchange contracts in the relevant currencies. The sensitivity
reported above in respect of sterling against the US dollar is wholly attributable to such net exposures. Otherwise the analysis excludes the
impact of foreign exchange risk on the translation of the net assets of such undertakings.
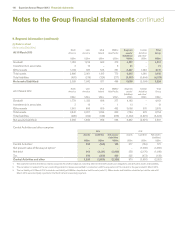
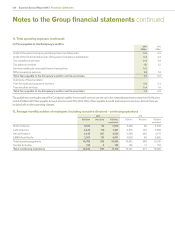
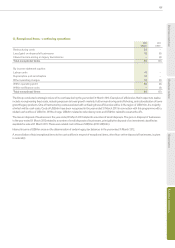
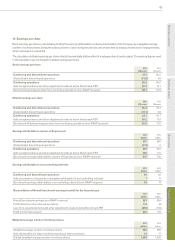
11. Total operating expenses
(a) Labour costs – continuing operations
2013
US$m
2012
US$m
Wages and salaries 1,302 1,222
Social security costs 212 194
Share incentive plans (note 35) 78 65
Pension costs – defined benefit plans (note 36) 7 9
Pension costs – defined contribution plans 45 45
Employee benefit costs 1,644 1,535
Other labour costs 189 164
1,833 1,699
Other labour costs include costs in respect of external contractors, outsourcing costs and costs relating to the recruitment, development and
training of employees. The definition, and analysis of the remuneration, of key management personnel is given in note 51.
(b) Depreciation and amortisation – continuing operations
2013
US$m
2012
US$m
Depreciation of property, plant and equipment 81 75
Amortisation of intangible assets (including exceptional asset write-offs of US$13m (2012: US$nil)) 384 359
465 434