Experian 2013 Annual Report Download - page 139
Download and view the complete annual report
Please find page 139 of the 2013 Experian annual report below. You can navigate through the pages in the report by either clicking on the pages listed below, or by using the keyword search tool below to find specific information within the annual report.-
 1
1 -
2
-
3
-
4
-
5
-
6
-
7
-
8
-
9
-
10
-
11
-
12
-
13
-
14
-
15
-
16
-
17
-
18
-
19
-
20
-
21
-
22
-
23
-
24
-
25
-
26
-
27
-
28
-
29
-
30
-
31
-
32
-
33
-
34
-
35
-
36
-
37
-
38
-
39
-
40
-
41
-
42
-
43
-
44
-
45
-
46
-
47
-
48
-
49
-
50
-
51
-
52
-
53
-
54
-
55
-
56
-
57
-
58
-
59
-
60
-
61
-
62
-
63
-
64
-
65
-
66
-
67
-
68
-
69
-
70
-
71
-
72
-
73
-
74
-
75
-
76
-
77
-
78
-
79
-
80
-
81
-
82
-
83
-
84
-
85
-
86
-
87
-
88
-
89
-
90
-
91
-
92
-
93
-
94
-
95
-
96
-
97
-
98
-
99
-
100
-
101
-
102
-
103
-
104
-
105
-
106
-
107
-
108
-
109
-
110
-
111
-
112
-
113
-
114
-
115
-
116
-
117
-
118
-
119
-
120
-
121
-
122
-
123
-
124
-
125
-
126
-
127
-
128
-
 129
129 -
 130
130 -
 131
131 -
 132
132 -
 133
133 -
 134
134 -
 135
135 -
 136
136 -
 137
137 -
 138
138 -
 139
139 -
 140
140 -
 141
141 -
 142
142 -
 143
143 -
 144
144 -
 145
145 -
 146
146 -
 147
147 -
 148
148 -
 149
149 -
150
-
151
-
152
-
153
-
154
-
155
-
156
-
157
-
158
-
159
-
160
-
161
-
162
-
163
-
164
-
165
-
166
-
167
-
168
-
169
-
170
-
171
-
172
-
173
-
174
-
175
-
176
 |
 |
137
Business review Business overview Governance Financial statements
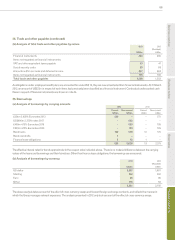
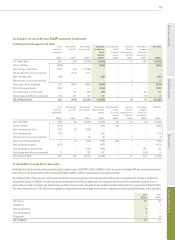
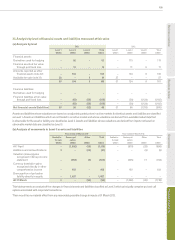
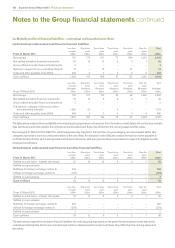
30. Analysis of net debt (non-GAAP measure) (continued)
(c) Analysis of changes in net debt
Cash
and cash
equivalents
US$m
Borrowings
(current)
US$m
Borrowings
(non-current)
US$m
Net debt
by balance
sheet
caption
US$m
Bank deposits
within
financial
assets
US$m
Accrued
interest
excluded from
net debt
US$m
Derivatives
hedging
loans and
borrowings
US$m
Net debt
US$m
At 1 April 2012 254 (13) (2,179) (1,938) – 17 103
(1,818)
Cash outflow (888) – – (888) –– –(888)
Borrowings cash flow 1,123 (91) (1,032) – –– – –
Reclassification of borrowings –(571) 571 –––––
Net interest paid (68) ––
(68) – – –
(68)
Movement on accrued interest –––– – 2 – 2
Net cash inflow/(outflow) 167 (662) (461) (956) – 2 –
(954)
Net share purchases (180) – – (180) – – – (180)
Fair value gains and losses – 15 (47) (32) – – 44 12
Exchange and other movements (12) 25 61 74 – – (72) 2
At 31 March 2013 229 (635) (2,626) (3,032) – 19 75 (2,938)
Cash
and cash
equivalents
US$m
Borrowings
(current)
US$m
Borrowings
(non-current)
US$m
Net debt by
balance sheet
caption
US$m
Bank deposits
within
financial
assets
US$m
Accrued
interest
excluded from
net debt
US$m
Derivatives
hedging
loans and
borrowings
US$m
Net debt
US$m
At 1 April 2011 408 (6) (1,921) (1,519) 14 10 (6) (1,501)
Cash outflow (114) – – (114) (14) – – (128)
Borrowings cash flow 175 (7) (168) – – – – –
Net interest paid (57) – – (57) – – –
(57)
Movement on accrued interest – – (4) (4) – 7 – 3
Net cash inflow/(outflow) 4 (7) (172) (175) (14) 7 – (182)
Net share purchases (167) – – (167) – – – (167)
Fair value gains and losses – – (139) (139) – – 162 23
Exchange and other movements 9 – 53 62 – – (53) 9
At 31 March 2012 254 (13) (2,179) (1,938) – 17 103 (1,818)
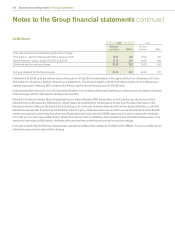
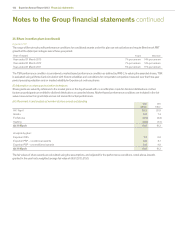
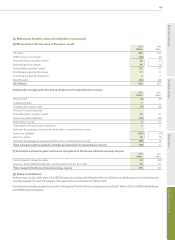
31. Available-for-sale financial assets
Available-for-sale financial assets comprise listed investments of US$38m (2012: US$35m) held to secure unfunded UK pension arrangements
(see note 37) and investments held overseas of US$3m (2012: US$2m). Movements are analysed below.
At 31 March 2013, if the relevant stock market and other indices had been 10% higher/lower with all other variables held constant, further fair
value gains/losses of US$4m would have been recognised in the Group statement of comprehensive income. In making its assessment of
reasonably possible changes, the Group has used the movements in relevant stock market and other indices for the year ended 31 March 2013.
The listed investments in the UK are managed by independent fund managers who seek to mitigate such risk by diversification of the portfolio.
2013
US$m
2012
US$m
At 1 April 37 42
Additions – 1
Reclassification 1–
Fair value gains 3 –
Disposals – (6)
At 31 March 41 37