Experian 2013 Annual Report Download - page 102
Download and view the complete annual report
Please find page 102 of the 2013 Experian annual report below. You can navigate through the pages in the report by either clicking on the pages listed below, or by using the keyword search tool below to find specific information within the annual report.-
 1
1 -
2
-
3
-
4
-
5
-
6
-
7
-
8
-
9
-
10
-
11
-
12
-
13
-
14
-
15
-
16
-
17
-
18
-
19
-
20
-
21
-
22
-
23
-
24
-
25
-
26
-
27
-
28
-
29
-
30
-
31
-
32
-
33
-
34
-
35
-
36
-
37
-
38
-
39
-
40
-
41
-
42
-
43
-
44
-
45
-
46
-
47
-
48
-
49
-
50
-
51
-
52
-
53
-
54
-
55
-
56
-
57
-
58
-
59
-
60
-
61
-
62
-
63
-
64
-
65
-
66
-
67
-
68
-
69
-
70
-
71
-
72
-
73
-
74
-
75
-
76
-
77
-
78
-
79
-
80
-
81
-
82
-
83
-
84
-
85
-
86
-
87
-
88
-
89
-
90
-
91
-
 92
92 -
 93
93 -
 94
94 -
 95
95 -
 96
96 -
 97
97 -
 98
98 -
 99
99 -
 100
100 -
 101
101 -
 102
102 -
 103
103 -
 104
104 -
 105
105 -
 106
106 -
 107
107 -
 108
108 -
 109
109 -
 110
110 -
 111
111 -
 112
112 -
113
-
114
-
115
-
116
-
117
-
118
-
119
-
120
-
121
-
122
-
123
-
124
-
125
-
126
-
127
-
128
-
129
-
130
-
131
-
132
-
133
-
134
-
135
-
136
-
137
-
138
-
139
-
140
-
141
-
142
-
143
-
144
-
145
-
146
-
147
-
148
-
149
-
150
-
151
-
152
-
153
-
154
-
155
-
156
-
157
-
158
-
159
-
160
-
161
-
162
-
163
-
164
-
165
-
166
-
167
-
168
-
169
-
170
-
171
-
172
-
173
-
174
-
175
-
176
 |
 |

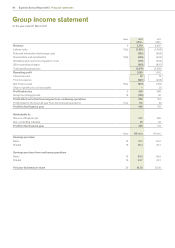
100 Experian Annual Report 2013 Financial statements
Group balance sheet
at 31 March 2013
Notes 2013
US$m
2012
US$m
Non-current assets
Goodwill 21 4,057 4,163
Other intangible assets 22 1,474 1,582
Property, plant and equipment 23 478 463
Investments in associates 24 21 13
Deferred tax assets 38(a) 643 320
Retirement benefit assets 36 80 130
Trade and other receivables 26 10 13
Available-for-sale financial assets 31 41 37
Other financial assets 32(a) 156 123
6,960 6,844
Current assets
Inventories 25 7 11
Trade and other receivables 26 923 910
Current tax assets 38(b) 49 10
Other financial assets 32(a) 27 7
Cash and cash equivalents 27 229 254
1,235 1,192
Assets classified as held for sale 17(c) – 118
1,235 1,310
Current liabilities
Trade and other payables 28 (1,197) (1,210)
Borrowings 29(a) (635) (13)
Current tax liabilities 38(b) (41) (56)
Provisions 39 (52) (38)
Other financial liabilities 32(a) (20) (1,098)
(1,945) (2,415)
Liabilities classified as held for sale 17(c) – (80)
(1,945) (2,495)
Net current liabilities (710) (1,185)
Total assets less current liabilities 6,250 5,659
Non-current liabilities
Trade and other payables 28 (41) (43)
Borrowings 29(a) (2,626) (2,179)
Deferred tax liabilities 38(a) (222) (379)
Retirement benefit obligations 36 (56) (53)
Provisions 39 (1) (10)
Other financial liabilities 32(a) (80) (64)
(3,026) (2,728)
Net assets 3,224 2,931
Equity
Called up share capital 40 102 102
Share premium account 40 1,480 1,471
Retained earnings 41 17,849 17,350
Other reserves 42 (16,247) (16,151)
Attributable to owners of Experian plc 3,184 2,772
Non-controlling interests 43 40 159
Tot al e quity 3,224 2,931
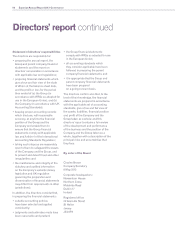
These financial statements were approved by the Board on 8 May 2013 and were signed on its behalf by:
Sir Alan Rudge
Director