Experian 2013 Annual Report Download - page 46
Download and view the complete annual report
Please find page 46 of the 2013 Experian annual report below. You can navigate through the pages in the report by either clicking on the pages listed below, or by using the keyword search tool below to find specific information within the annual report.-
 1
1 -
2
-
3
-
4
-
5
-
6
-
7
-
8
-
9
-
10
-
11
-
12
-
13
-
14
-
15
-
16
-
17
-
18
-
19
-
20
-
21
-
22
-
23
-
24
-
25
-
26
-
27
-
28
-
29
-
30
-
31
-
32
-
33
-
34
-
35
-
 36
36 -
 37
37 -
 38
38 -
 39
39 -
 40
40 -
 41
41 -
 42
42 -
 43
43 -
 44
44 -
 45
45 -
 46
46 -
 47
47 -
 48
48 -
 49
49 -
 50
50 -
 51
51 -
 52
52 -
 53
53 -
 54
54 -
 55
55 -
 56
56 -
57
-
58
-
59
-
60
-
61
-
62
-
63
-
64
-
65
-
66
-
67
-
68
-
69
-
70
-
71
-
72
-
73
-
74
-
75
-
76
-
77
-
78
-
79
-
80
-
81
-
82
-
83
-
84
-
85
-
86
-
87
-
88
-
89
-
90
-
91
-
92
-
93
-
94
-
95
-
96
-
97
-
98
-
99
-
100
-
101
-
102
-
103
-
104
-
105
-
106
-
107
-
108
-
109
-
110
-
111
-
112
-
113
-
114
-
115
-
116
-
117
-
118
-
119
-
120
-
121
-
122
-
123
-
124
-
125
-
126
-
127
-
128
-
129
-
130
-
131
-
132
-
133
-
134
-
135
-
136
-
137
-
138
-
139
-
140
-
141
-
142
-
143
-
144
-
145
-
146
-
147
-
148
-
149
-
150
-
151
-
152
-
153
-
154
-
155
-
156
-
157
-
158
-
159
-
160
-
161
-
162
-
163
-
164
-
165
-
166
-
167
-
168
-
169
-
170
-
171
-
172
-
173
-
174
-
175
-
176
 |
 |

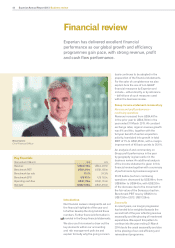
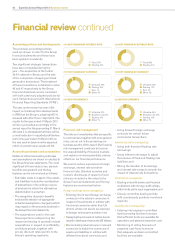
Financial review
Experian has delivered excellent financial
performance as our global growth and efficiency
programmes gain pace, with strong revenue, profit
and cash flow performance.
Introduction
Our financial review is designed to set out
the financial highlights of the year and
to further develop the story behind these
numbers. Further financial information is
provided in the Group financial statements.
We also use this review to draw out the
key elements within our accounting
and risk management policies and
explain formally why the going concern
basis continues to be adopted in the
preparation of the financial statements.
For the sake of completeness we also
explain here the use of non-GAAP
financial measures by Experian and
include – either directly or by reference
– definitions of such measures used
within the business review.
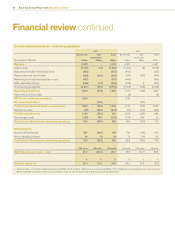
Group income statement commentary
Revenue and profit performance –
continuing operations
Revenue increased from US$4,487m
in the prior year to US$4,730m in the
year ended 31 March 2013. At constant
exchange rates, organic revenue growth
was 8% and this, together with the
full year benefit of earlier acquisition
activity, translated into growth in total
EBIT of 7% to US$1,253m, with a margin
improvement of 40 basis points to 26.6%.
An analysis of and commentary on
Group profit performance in the year
by geography is given earlier in the
business review. An additional analysis
of the income statement is given in this
financial review together with a summary
of performance by business segment.
Profit before tax from continuing
operations decreased by US$249m, from
US$689m to US$440m, with US$233m
of the decrease due to the movement in
the fair value of the Serasa put option.
Benchmark PBT rose by US$67m to
US$1,195m (2012: US$1,128m).
Seasonality
In recent years, our margin progression
has tended to be weighted towards the
second half of the year reflecting revenue
seasonality and the phasing of investment
expenditure. We expect this pattern to
continue into the year ending 31 March
2014 due to the usual seasonality and also
to the phasing of our cost efficiency and
reinvestment programme.
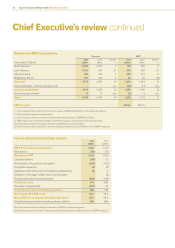
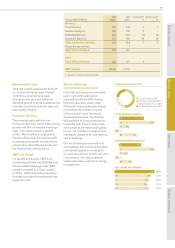
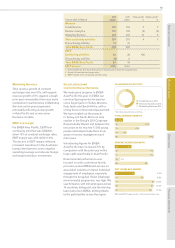
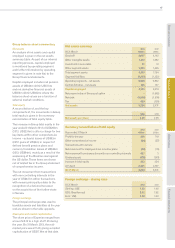
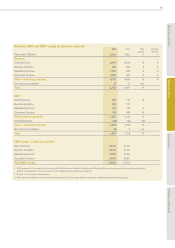
Key financials
Year ended 31 March 2013 2012
Revenue US$4,730m US$4,487m
Benchmark PBT US$1,195m US$1,128m
Benchmark tax rate 25.3% 24.3%
Benchmark EPS US 85.7c US 78.9c
Operating cash flow US$1,175m US$1,124m
Net debt US$2,938m US$1,818m
Brian Cassin
Chief Financial Officer
P98
44 Experian Annual Report 2013 Business review