Experian 2013 Annual Report Download - page 136
Download and view the complete annual report
Please find page 136 of the 2013 Experian annual report below. You can navigate through the pages in the report by either clicking on the pages listed below, or by using the keyword search tool below to find specific information within the annual report.-
 1
1 -
2
-
3
-
4
-
5
-
6
-
7
-
8
-
9
-
10
-
11
-
12
-
13
-
14
-
15
-
16
-
17
-
18
-
19
-
20
-
21
-
22
-
23
-
24
-
25
-
26
-
27
-
28
-
29
-
30
-
31
-
32
-
33
-
34
-
35
-
36
-
37
-
38
-
39
-
40
-
41
-
42
-
43
-
44
-
45
-
46
-
47
-
48
-
49
-
50
-
51
-
52
-
53
-
54
-
55
-
56
-
57
-
58
-
59
-
60
-
61
-
62
-
63
-
64
-
65
-
66
-
67
-
68
-
69
-
70
-
71
-
72
-
73
-
74
-
75
-
76
-
77
-
78
-
79
-
80
-
81
-
82
-
83
-
84
-
85
-
86
-
87
-
88
-
89
-
90
-
91
-
92
-
93
-
94
-
95
-
96
-
97
-
98
-
99
-
100
-
101
-
102
-
103
-
104
-
105
-
106
-
107
-
108
-
109
-
110
-
111
-
112
-
113
-
114
-
115
-
116
-
117
-
118
-
119
-
120
-
121
-
122
-
123
-
124
-
125
-
 126
126 -
 127
127 -
 128
128 -
 129
129 -
 130
130 -
 131
131 -
 132
132 -
 133
133 -
 134
134 -
 135
135 -
 136
136 -
 137
137 -
 138
138 -
 139
139 -
 140
140 -
 141
141 -
 142
142 -
 143
143 -
 144
144 -
 145
145 -
 146
146 -
147
-
148
-
149
-
150
-
151
-
152
-
153
-
154
-
155
-
156
-
157
-
158
-
159
-
160
-
161
-
162
-
163
-
164
-
165
-
166
-
167
-
168
-
169
-
170
-
171
-
172
-
173
-
174
-
175
-
176
 |
 |

134 Experian Annual Report 2013 Financial statements
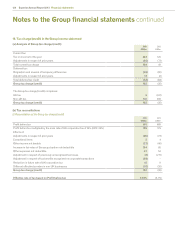
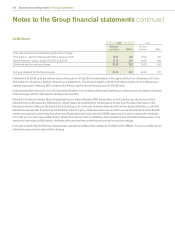
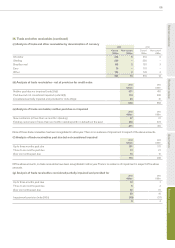
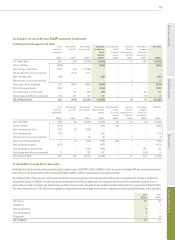
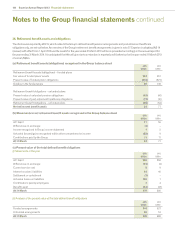
26. Trade and other receivables (continued)
(h) Movements in the impairment provision
2013
US$m
2012
US$m
At 1 April 37 47
Differences on exchange (3) (4)
Provision for impairment 32 24
Provision utilised in respect of debts written off (15) (18)
Unused amounts reversed (11) (12)
At 31 March 40 37
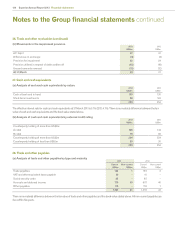
27. Cash and cash equivalents
(a) Analysis of cash and cash equivalents by nature
2013
US$m
2012
US$m
Cash at bank and in hand 139 130
Short-term investments 90 124
229 254
The effective interest rate for cash and cash equivalents at 31 March 2013 is 3.7% (2012: 4.7%). There is no material difference between the fair
value of cash and cash equivalents and the book value stated above.
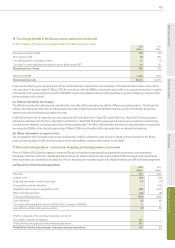
(b) Analysis of cash and cash equivalents by external credit rating
2013
US$m
2012
US$m
Counterparty holding of more than US$2m:
A rated 125 144
B rated 79 80
Counterparty holding of more than US$2m 204 224
Counterparty holding of less than US$2m 25 30
229 254
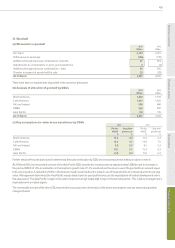
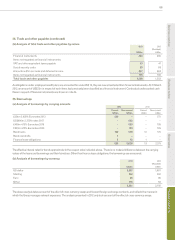
28. Trade and other payables
(a) Analysis of trade and other payables by type and maturity
2013 2012
Current
US$m
Non-current
US$m
Current
US$m
Non-current
US$m
Trade payables 184 1
159 2
VAT and other equivalent taxes payable 43 –
41 –
Social security costs 85 –
85 –
Accruals and deferred income 773 40
807 40
Other payables 112 – 118 1
1,197 41 1,210 43
There is no material difference between the fair value of trade and other payables and the book value stated above. All non-current payables are
due within five years.
Notes to the Group financial statements continued