Experian 2013 Annual Report Download - page 115
Download and view the complete annual report
Please find page 115 of the 2013 Experian annual report below. You can navigate through the pages in the report by either clicking on the pages listed below, or by using the keyword search tool below to find specific information within the annual report.-
 1
1 -
2
-
3
-
4
-
5
-
6
-
7
-
8
-
9
-
10
-
11
-
12
-
13
-
14
-
15
-
16
-
17
-
18
-
19
-
20
-
21
-
22
-
23
-
24
-
25
-
26
-
27
-
28
-
29
-
30
-
31
-
32
-
33
-
34
-
35
-
36
-
37
-
38
-
39
-
40
-
41
-
42
-
43
-
44
-
45
-
46
-
47
-
48
-
49
-
50
-
51
-
52
-
53
-
54
-
55
-
56
-
57
-
58
-
59
-
60
-
61
-
62
-
63
-
64
-
65
-
66
-
67
-
68
-
69
-
70
-
71
-
72
-
73
-
74
-
75
-
76
-
77
-
78
-
79
-
80
-
81
-
82
-
83
-
84
-
85
-
86
-
87
-
88
-
89
-
90
-
91
-
92
-
93
-
94
-
95
-
96
-
97
-
98
-
99
-
100
-
101
-
102
-
103
-
104
-
 105
105 -
 106
106 -
 107
107 -
 108
108 -
 109
109 -
 110
110 -
 111
111 -
 112
112 -
 113
113 -
 114
114 -
 115
115 -
 116
116 -
 117
117 -
 118
118 -
 119
119 -
 120
120 -
 121
121 -
 122
122 -
 123
123 -
 124
124 -
 125
125 -
126
-
127
-
128
-
129
-
130
-
131
-
132
-
133
-
134
-
135
-
136
-
137
-
138
-
139
-
140
-
141
-
142
-
143
-
144
-
145
-
146
-
147
-
148
-
149
-
150
-
151
-
152
-
153
-
154
-
155
-
156
-
157
-
158
-
159
-
160
-
161
-
162
-
163
-
164
-
165
-
166
-
167
-
168
-
169
-
170
-
171
-
172
-
173
-
174
-
175
-
176
 |
 |

113
Business review Business overview Governance Financial statements
7. Use of non-GAAP measures in the Group financial statements (continued)
Earnings before interest, tax, depreciation and amortisation (‘EBITDA’)
EBITDA is defined as EBIT before depreciation and amortisation, less amortisation of acquisition intangibles.
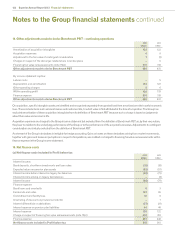
Benchmark earnings
Benchmark earnings represents Benchmark PBT less attributable tax and non-controlling interests. Benchmark earnings attributable to non-
controlling interests represents that portion of Benchmark earnings that relate to non-controlling interests. Benchmark PBT less attributable tax
is designated as Overall benchmark earnings. The attributable tax for the purposes of determining Benchmark earnings excludes significant tax
credits and charges arising in the year which, in view of their size or nature, are not comparable with previous years together with tax arising on
exceptional items and on total adjustments made to derive Benchmark PBT.
Benchmark earnings per share (‘Benchmark EPS’)
Benchmark EPS represents Benchmark earnings divided by a weighted average number of ordinary shares, and is disclosed to indicate the
underlying profitability of the Group.
Benchmark tax charge and rate
The Benchmark tax charge is defined as the total tax charge or credit as reported in the Group income statement, adjusted for the tax impact of
non-Benchmark items. The related effective rate of tax is calculated by dividing the Benchmark tax charge by Benchmark PBT.
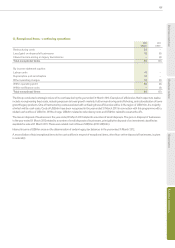
Exceptional items
The separate reporting of non-recurring exceptional items gives an indication of the Group’s underlying performance. Exceptional items are
those arising from the profit or loss on disposal of businesses, closure costs of major business units and costs of significant restructuring
programmes. All other restructuring costs are charged against EBIT in the segments in which they are incurred.
Operating and free cash flow
Operating cash flow is calculated as cash generated from operations adjusted for outflows in respect of acquisition expenses, the purchase and
disposal of property, plant and equipment and other intangible assets and adding dividends from continuing associates but excluding any cash
flows in respect of exceptional items. It is reconciled to cash generated from operations in note 44(j).
Operating cash flow is defined as EBIT from continuing operations, plus depreciation, amortisation and charges in respect of share incentive
plans within Benchmark PBT, less capital expenditure net of disposal proceeds and further adjusted for changes in working capital and profit
or loss retained in continuing associates. Free cash flow is derived from operating cash flow by excluding net interest, tax paid in respect of
continuing operations and dividends paid to non-controlling interests.
Cash flow conversion
Cash flow conversion is defined as operating cash flow expressed as a percentage of EBIT.
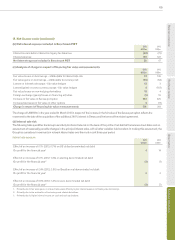
Net debt
Net debt is calculated as total debt less cash and cash equivalents and other highly liquid bank deposits with original maturities greater than
three months. Total debt includes borrowings (and the fair value of derivatives hedging borrowings), overdrafts and obligations under finance
leases. Accrued interest is excluded from net debt.
8. Financial risk management
(a) Financial risk factors
The Group’s activities expose it to a variety of financial risks:
•market risk (including foreign exchange risk, interest rate risk and price risk);
•credit risk; and
•liquidity risk.
These risks are unchanged from those reported in the annual report for the year ended 31 March 2012 but the narrative below now excludes
information in respect of the Serasa put option, as that was settled during the year ended 31 March 2013 (see note 33). The numeric disclosures
in respect of financial risks are now included within later notes to the financial statements, rather than within this note as previously, so as to
provide a more transparent linkage of financial risks and results.
Financial risks represent part of the Group’s risks in relation to its strategy and business objectives and a full discussion of all such risks is
contained within the separate protecting our business section of the annual report. The Group’s financial risk management focuses on the
unpredictability of financial markets and seeks to minimise potentially adverse effects on the Group’s financial performance. The Group seeks to
reduce its exposure to financial risks and uses derivative financial instruments to hedge certain risk exposures. The Group also ensures surplus
funds are managed and controlled in a prudent manner which will protect capital sums invested and ensure adequate short-term liquidity.