Experian 2013 Annual Report Download - page 133
Download and view the complete annual report
Please find page 133 of the 2013 Experian annual report below. You can navigate through the pages in the report by either clicking on the pages listed below, or by using the keyword search tool below to find specific information within the annual report.-
 1
1 -
2
-
3
-
4
-
5
-
6
-
7
-
8
-
9
-
10
-
11
-
12
-
13
-
14
-
15
-
16
-
17
-
18
-
19
-
20
-
21
-
22
-
23
-
24
-
25
-
26
-
27
-
28
-
29
-
30
-
31
-
32
-
33
-
34
-
35
-
36
-
37
-
38
-
39
-
40
-
41
-
42
-
43
-
44
-
45
-
46
-
47
-
48
-
49
-
50
-
51
-
52
-
53
-
54
-
55
-
56
-
57
-
58
-
59
-
60
-
61
-
62
-
63
-
64
-
65
-
66
-
67
-
68
-
69
-
70
-
71
-
72
-
73
-
74
-
75
-
76
-
77
-
78
-
79
-
80
-
81
-
82
-
83
-
84
-
85
-
86
-
87
-
88
-
89
-
90
-
91
-
92
-
93
-
94
-
95
-
96
-
97
-
98
-
99
-
100
-
101
-
102
-
103
-
104
-
105
-
106
-
107
-
108
-
109
-
110
-
111
-
112
-
113
-
114
-
115
-
116
-
117
-
118
-
119
-
120
-
121
-
122
-
 123
123 -
 124
124 -
 125
125 -
 126
126 -
 127
127 -
 128
128 -
 129
129 -
 130
130 -
 131
131 -
 132
132 -
 133
133 -
 134
134 -
 135
135 -
 136
136 -
 137
137 -
 138
138 -
 139
139 -
 140
140 -
 141
141 -
 142
142 -
 143
143 -
144
-
145
-
146
-
147
-
148
-
149
-
150
-
151
-
152
-
153
-
154
-
155
-
156
-
157
-
158
-
159
-
160
-
161
-
162
-
163
-
164
-
165
-
166
-
167
-
168
-
169
-
170
-
171
-
172
-
173
-
174
-
175
-
176
 |
 |

131
Business review Business overview Governance Financial statements
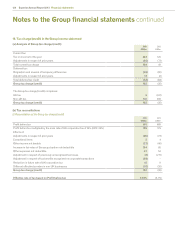
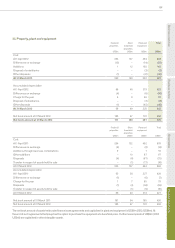
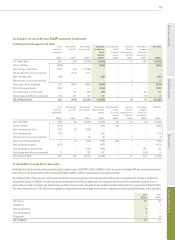
23. Property, plant and equipment
Freehold
properties
US$m
Short
leasehold
properties
US$m
Plant and
equipment
US$m
Total
US$m
Cost
At 1 April 2012 253 137 494 884
Differences on exchange (13) – (14) (27)
Additions 1 12 102
115
Disposal of subsidiaries – – (3) (3)
Other disposals (1) – (47) (48)
At 31 March 2013 240 149 532 921
Accumulated depreciation
At 1 April 2012 68 40 313
421
Differences on exchange (4) – (6) (10)
Charge for the year 6 9 66
81
Disposal of subsidiaries – – (3) (3)
Other disposals (1) – (45) (46)
At 31 March 2013 69 49 325 443
Net book amount at 31 March 2012 185 97 181 463
Net book amount at 31 March 2013 171 100 207 478
Freehold
properties
US$m
Short
leasehold
properties
US$m
Plant and
equipment
US$m
Total
US$m
Cost
At 1 April 2011 254 132 492 878
Differences on exchange (6) – (8) (14)
Additions through business combinations 9 – 7 16
Other additions – 10 87 97
Disposals (4) (4) (67) (75)
Transfer in respect of assets held for sale – (1) (17) (18)
At 31 March 2012 253 137 494 884
Accumulated depreciation
At 1 April 2011 63 38 327 428
Differences on exchange (1) – (6) (7)
Charge for the year 7 7 65 79
Disposals (1) (4) (64) (69)
Transfer in respect of assets held for sale – (1) (9) (10)
At 31 March 2012 68 40 313 421
Net book amount at 31 March 2011 191 94 165 450
Net book amount at 31 March 2012 185 97 181 463
The net book amount of assets held under finance lease agreements and capitalised in plant and equipment is US$6m (2012: US$8m). At
the end of such agreements the Group has the option to purchase the equipment at a beneficial price. Further leased assets of US$9m (2012:
US$nil) are capitalised in other intangible assets.