Experian 2013 Annual Report Download - page 47
Download and view the complete annual report
Please find page 47 of the 2013 Experian annual report below. You can navigate through the pages in the report by either clicking on the pages listed below, or by using the keyword search tool below to find specific information within the annual report.-
 1
1 -
2
-
3
-
4
-
5
-
6
-
7
-
8
-
9
-
10
-
11
-
12
-
13
-
14
-
15
-
16
-
17
-
18
-
19
-
20
-
21
-
22
-
23
-
24
-
25
-
26
-
27
-
28
-
29
-
30
-
31
-
32
-
33
-
34
-
35
-
36
-
 37
37 -
 38
38 -
 39
39 -
 40
40 -
 41
41 -
 42
42 -
 43
43 -
 44
44 -
 45
45 -
 46
46 -
 47
47 -
 48
48 -
 49
49 -
 50
50 -
 51
51 -
 52
52 -
 53
53 -
 54
54 -
 55
55 -
 56
56 -
 57
57 -
58
-
59
-
60
-
61
-
62
-
63
-
64
-
65
-
66
-
67
-
68
-
69
-
70
-
71
-
72
-
73
-
74
-
75
-
76
-
77
-
78
-
79
-
80
-
81
-
82
-
83
-
84
-
85
-
86
-
87
-
88
-
89
-
90
-
91
-
92
-
93
-
94
-
95
-
96
-
97
-
98
-
99
-
100
-
101
-
102
-
103
-
104
-
105
-
106
-
107
-
108
-
109
-
110
-
111
-
112
-
113
-
114
-
115
-
116
-
117
-
118
-
119
-
120
-
121
-
122
-
123
-
124
-
125
-
126
-
127
-
128
-
129
-
130
-
131
-
132
-
133
-
134
-
135
-
136
-
137
-
138
-
139
-
140
-
141
-
142
-
143
-
144
-
145
-
146
-
147
-
148
-
149
-
150
-
151
-
152
-
153
-
154
-
155
-
156
-
157
-
158
-
159
-
160
-
161
-
162
-
163
-
164
-
165
-
166
-
167
-
168
-
169
-
170
-
171
-
172
-
173
-
174
-
175
-
176
 |
 |

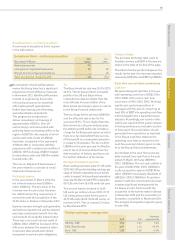
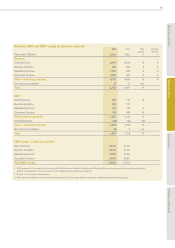
Exceptional items – continuing operations
A summary of exceptional items is given
in the table below.
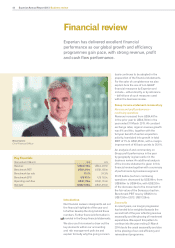
As indicated in the Chief Executive’s
review, the Group launched a significant
programme of cost-efficiency measures
in November 2012. Identified efficiencies
include re-engineering fixed costs,
re-focusing resources on areas that
offer higher growth opportunities,
further near-shoring and off-shoring,
and rationalisation of products.
This programme is expected to
deliver annualised cost savings of
approximately US$75m. One-off
restructuring costs associated with
achieving these cost savings will be in the
region of US$110m, the majority of which
will be cash costs. Costs of US$54m
have been recognised in the year ended
31 March 2013 in connection with this
programme with a related cash outflow of
US$27m. Of this charge, US$41m related
to redundancy costs and US$13m related
to asset write-offs.
The loss on disposal of businesses in
the year related to a number of small
disposals of businesses.
Net interest expense
In the year ended 31 March 2013, the
net interest expense was US$58m
(2012: US$47m). The key driver of the
increase over the prior year has been
the additional funding requirement in
connection with the acquisition of the
29.6% stake in Serasa in November 2012.
Experian remains strongly cash generative
and both our interest cost and the amount
paid have continued to benefit from the
environment of low global interest rates.
There was a non-cash interest credit of
US$8m (2012: US$11m) in respect of the
difference between the expected return
on pension plan assets and interest
recognised on pension plan obligations.
Tax
The Benchmark tax rate was 25.3% (2012:
24.3%). The increase reflects increased
profits in the US and Brazil where
corporate tax rates are higher than the
main UK rate. A reconciliation of the
Benchmark tax charge is given in note 16
to the Group financial statements.
The tax charge for the year was US$152m
and the effective rate of tax for the
year was 34.5%. This is higher than the
Benchmark tax rate primarily because
the statutory profit before tax includes a
charge for the Serasa put option on which
there is no tax relief whilst there is a one-
off tax benefit on a corporate transaction
in respect of Computec. The tax credit of
US$35m in the prior year and its effective
rate of tax of (5.1%) benefited from the
determination of historic positions and
the further utilisation of tax losses.
Earnings and dividends per share
Basic earnings per share were 37.1 US cents
(2012: 66.2 US cents) including earnings per
share of 11.9 US cents (2012: loss of 0.6 US
cents) in respect of discontinued operations
(see note 19). Benchmark EPS increased to
85.7 US cents from 78.9 US cents last year.
The second interim dividend is 24.00
US cents per ordinary share (2012: 21.75
US cents) giving a total for the year of
34.75 US cents (2012: 32.00 US cents), an
increase of 9%. This is covered 2.5 times
by Benchmark EPS.
Foreign exchange
The principal exchange rates used to
translate revenue and EBIT in the year are
shown in the table at the foot of the page.
The effect of exchange rate changes on the
results for the year is to decrease reported
revenue by US$196m and EBIT by US$67m.
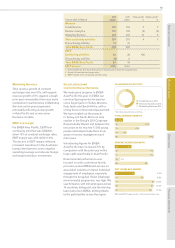
Cash flow and net debt commentary
Cash flow
We generated good cash flow in the year
with operating cash flow of US$1,175m
(2012: US$1,124m) and a cash flow
conversion of 94% (2012: 96%). Working
capital and capital expenditure is
managed with the aim of converting at
least 90% of EBIT into operating cash flow
and this target forms a key performance
indicator. Accordingly, our record on this
metric over a period of five years is shown
in the key performance indicators section
of this report. A reconciliation of cash
generated from operations as reported
in the Group cash flow statement to
operating cash flow as reported in the
cash flow summary table is given in note
44 to the Group financial statements.
As indicated in the cash flow summary
table overleaf, free cash flow in the year
ended 31 March 2013 was US$891m
(2012: US$889m). The net cash outflow in
the year of US$1,018m (2012: US$182m)
is after acquisition spend of US$1,549m
(2012: US$787m) and equity dividends of
US$322m (2012: US$290m). Acquisition
spend in both the current and prior years
includes significant developments for
the Group in Latin America with the
acquisition of the further stake in Serasa
in November 2012 and the acquisition of
Computec, completed in November 2011.
The analysis of acquisition spend is given
in note 44(f).
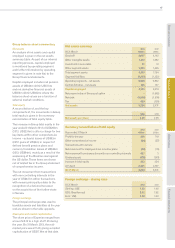
Exceptional items – continuing operations
Year ended 31 March
2013
US$m
2012
US$m
Restructuring costs 54 –
Loss/(gain) on disposal of businesses 12 (8)
Interest income on legacy tax balances –(4)
Total exceptional charge/(credit) 66 (12)
Foreign exchange – average rates
2013 2012
Weakened
against the US$
Sterling : US$ 1.58 1.60 1.2%
US$ : Brazilian real 2.01 1.70 18.2%
Euro : US$ 1.29 1.38 6.5%
P32
Business overview Business review Governance Financial statements
45