Experian 2013 Annual Report Download - page 145
Download and view the complete annual report
Please find page 145 of the 2013 Experian annual report below. You can navigate through the pages in the report by either clicking on the pages listed below, or by using the keyword search tool below to find specific information within the annual report.-
 1
1 -
2
-
3
-
4
-
5
-
6
-
7
-
8
-
9
-
10
-
11
-
12
-
13
-
14
-
15
-
16
-
17
-
18
-
19
-
20
-
21
-
22
-
23
-
24
-
25
-
26
-
27
-
28
-
29
-
30
-
31
-
32
-
33
-
34
-
35
-
36
-
37
-
38
-
39
-
40
-
41
-
42
-
43
-
44
-
45
-
46
-
47
-
48
-
49
-
50
-
51
-
52
-
53
-
54
-
55
-
56
-
57
-
58
-
59
-
60
-
61
-
62
-
63
-
64
-
65
-
66
-
67
-
68
-
69
-
70
-
71
-
72
-
73
-
74
-
75
-
76
-
77
-
78
-
79
-
80
-
81
-
82
-
83
-
84
-
85
-
86
-
87
-
88
-
89
-
90
-
91
-
92
-
93
-
94
-
95
-
96
-
97
-
98
-
99
-
100
-
101
-
102
-
103
-
104
-
105
-
106
-
107
-
108
-
109
-
110
-
111
-
112
-
113
-
114
-
115
-
116
-
117
-
118
-
119
-
120
-
121
-
122
-
123
-
124
-
125
-
126
-
127
-
128
-
129
-
130
-
131
-
132
-
133
-
134
-
 135
135 -
 136
136 -
 137
137 -
 138
138 -
 139
139 -
 140
140 -
 141
141 -
 142
142 -
 143
143 -
 144
144 -
 145
145 -
 146
146 -
 147
147 -
 148
148 -
 149
149 -
 150
150 -
 151
151 -
 152
152 -
 153
153 -
 154
154 -
 155
155 -
156
-
157
-
158
-
159
-
160
-
161
-
162
-
163
-
164
-
165
-
166
-
167
-
168
-
169
-
170
-
171
-
172
-
173
-
174
-
175
-
176
 |
 |

143
Business review Business overview Governance Financial statements
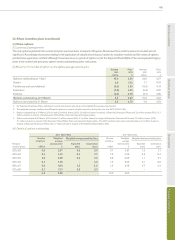
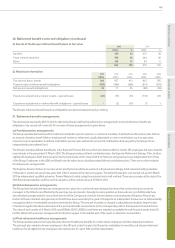
35. Share incentive plans (continued)
(c) Share options
(i) Summary of arrangements
The only options granted in the current and prior year have been in respect of Experian Sharesave Plans and the amounts involved are not
significant. Accordingly disclosures relating to the application of valuation techniques, inputs into valuation models and fair values of options
granted have again been omitted. Although there have been no grants of options under the Experian Share Option Plan and equivalent legacy
plans in the current and prior year, options remain outstanding under such plans.
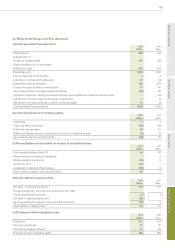
(ii) Movement in number of options and weighted average exercise price
Number
2013
million
Price
2013
£
Number
2012
million
Price
2012
£
Options outstanding at 1 April 15.0 4.63
24.8 4.27
Grants 0.8 7.13 1.1 6.16
Forfeitures and cancellations1(0.4) 4.99 (0.9) 4.74
Exercises2(9.0) 4.55 (9.9) 3.87
Expiries (0.2) 4.90 (0.1) 4.85
Options outstanding at 31 March 6.2 5.02 15.0 4.63
Options exercisable at 31 March 3.4 4.70 3.8 4.54
1. For Experian Sharesave Plans, forfeitures include non-leavers who have not completed the savings requirement.
2. The weighted average market price of Experian shares in respect of option exercises during the year was £9.79 (2012: £7.84).
3. Options outstanding at 31 March 2013 include 2.9 million shares (2012: 2.9 million shares) in respect of Experian Sharesave Plans and 3.3 million shares (2012: 12.1
million shares) in respect of the Experian Share Option Plan and equivalent legacy plans.
4. Options exercisable at 31 March 2013 include 0.1 million shares (2012: 0.1 million shares) in respect of Experian Sharesave Plans and 3.3 million shares (2012:
3.7 million shares) in respect of the Experian Share Option Plan and equivalent legacy plans. The 2012 numbers were previously reported as 3.7 million shares in
respect of Experian Sharesave Plans and 0.1 million shares in respect of the Experian Share Option Plan.
(iii) Details of options outstanding
At 31 March 2013 At 31 March 2012
Range of
exercise prices
Number
of options
million
Weighted
average
exercise price
£
Weighted average remaining lives Number
of options
million
Weighted
average
exercise price
£
Weighted average remaining lives
Expected
years
Contractual
years
Expected
years
Contractual
years
£2 to £3 0.6 2.91 0.5 0.9 0.7 2.91 1.3 1.7
£3 to £4 0.4 3.35 0.5 4.1 1.6 3.36 0.4 6.3
£4 to £5 2.9 4.69 0.3 4.4 9.8 4.66 1.1 9.1
£5 to £6 0.7 5.39 – 3.2 1.9 5.39 0.1 6.6
£6 to £7 0.9 6.18 1.8 2.2 1.0 6.18 2.7 3.3
£7 to £8 0.7 7.13 2.9 3.3 – – – –
6.2 5.00 15.0 4.63