Dish Network 2010 Annual Report Download - page 65
Download and view the complete annual report
Please find page 65 of the 2010 Dish Network annual report below. You can navigate through the pages in the report by either clicking on the pages listed below, or by using the keyword search tool below to find specific information within the annual report.-
 1
1 -
2
-
3
-
4
-
5
-
6
-
7
-
8
-
9
-
10
-
11
-
12
-
13
-
14
-
15
-
16
-
17
-
18
-
19
-
20
-
21
-
22
-
23
-
24
-
25
-
26
-
27
-
28
-
29
-
30
-
31
-
32
-
33
-
34
-
35
-
36
-
37
-
38
-
39
-
40
-
41
-
42
-
43
-
44
-
45
-
46
-
47
-
48
-
49
-
50
-
51
-
52
-
53
-
54
-
 55
55 -
 56
56 -
 57
57 -
 58
58 -
 59
59 -
 60
60 -
 61
61 -
 62
62 -
 63
63 -
 64
64 -
 65
65 -
 66
66 -
 67
67 -
 68
68 -
 69
69 -
 70
70 -
 71
71 -
 72
72 -
 73
73 -
 74
74 -
 75
75 -
76
-
77
-
78
-
79
-
80
-
81
-
82
-
83
-
84
-
85
-
86
-
87
-
88
-
89
-
90
-
91
-
92
-
93
-
94
-
95
-
96
-
97
-
98
-
99
-
100
-
101
-
102
-
103
-
104
-
105
-
106
-
107
-
108
-
109
-
110
-
111
-
112
-
113
-
114
-
115
-
116
-
117
-
118
-
119
-
120
-
121
-
122
-
123
-
124
-
125
-
126
-
127
-
128
-
129
-
130
-
131
-
132
-
133
-
134
-
135
-
136
-
137
-
138
-
139
-
140
-
141
-
142
-
143
-
144
-
145
-
146
-
147
-
148
 |
 |

Item 7. MANAGEMENT’S DISCUSSION AND ANALYSIS OF FINANCIAL CONDITION AND
RESULTS OF OPERATIONS - Continued
58
58
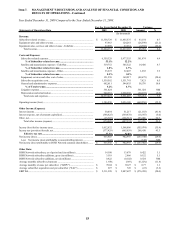
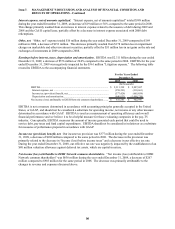
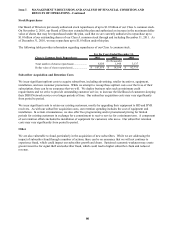
The following table reconciles free cash flow to “Net cash flows from operating activities.”
2010 2009 2008
Free cash flow........................................................... 923,670$ 1,157,353$ 1,058,454$
Add back:
Purchases of property and equipment................... 1,216,132 1,037,190 1,129,890
Net cash flows from operating activities................... 2,139,802$ 2,194,543$ 2,188,344$
For the Years Ended December 31,
(In thousands)
The decrease in free cash flow from 2009 to 2010 of $234 million resulted from a decrease in “Net cash flows from
operating activities” of $55 million or 2.5% and an increase in “Purchases of property and equipment” of $179 million
or 17.3%. The decrease in “Net cash flows from operating activities” was primarily attributable to a $605 million
decrease in cash resulting from changes in operating assets and liabilities, partially offset by a $543 million increase in
net income, adjusted to exclude non-cash changes in “Deferred tax expense (benefit),” “Realized and unrealized losses
(gains) on investments,” and “Depreciation and amortization” expense. The decrease in cash resulting from changes in
operating assets and liabilities is principally attributable to the increase in inventory and timing differences between
book expense and cash payments, primarily related to income taxes and litigation expense. The increase in “Purchases
of property and equipment” in 2010 was primarily attributable to the assignment of certain rights under a launch
contract for EchoStar XV and an increase in expenditures for equipment under our lease program for new subscribers.
The increase in free cash flow from 2008 to 2009 of $99 million resulted from an increase in “Net cash flows from
operating activities” of $6 million or 0.3% and a decrease in “Purchases of property and equipment” of $93 million or
8.2%. The increase in “Net cash flows from operating activities” was primarily attributable to an $877 million increase
in cash resulting from changes in operating assets and liabilities, partially offset by a $871 million decrease in net
income, adjusted to exclude non-cash changes in “Depreciation and amortization” expense, “Realized and unrealized
losses (gains) on investments,” and “Deferred tax expense (benefit).” The increase in cash resulting from changes in
operating assets and liabilities primarily relates to timing differences between book expense and cash payments,
including a $361 million increase in the litigation accrual and a $386 million increase in cash flow related to working
capital changes and other long-term operating assets. The decrease in “Purchases of property and equipment” in 2009
was primarily attributable to a decline in expenditures for satellite construction, and equipment under our lease program
for existing subscribers, partially offset by increased spending for equipment under our lease program for new
subscribers.
Cash flows from operating activities. We typically reinvest the cash flow from operating activities in our business
primarily to grow our subscriber base and to expand our infrastructure. For the years ended December 31, 2010,
2009 and 2008, we reported net cash flows from operating activities of $2.140 billion, $2.195 billion, and $2.188
billion, respectively. See discussion of changes in net cash flows from operating activities included in “Free cash
flow” above.
Cash flows from investing activities. Our investing activities generally include purchases and sales of marketable
investment securities, strategic investments and cash used to grow our subscriber base and expand our infrastructure.
For the years ended December 31, 2010, 2009 and 2008, we reported net cash outflows from investing activities of
$1.478 billion, $2.606 billion and $1.597 billion, respectively. During the years ended December 31, 2010, 2009 and
2008, capital expenditures for new and existing customer equipment totaled $942 million, $876 million and $920
million, respectively.
The decrease in net cash outflows from investing activities from 2009 to 2010 of $1.128 billion primarily resulted from
a net decrease in purchases of marketable investment securities, partially offset by an increase in capital expenditures
including the assignment of certain rights under a launch contract from EchoStar.
The increase in net cash outflows from investing activities from 2008 to 2009 of $1.008 billion primarily resulted from
a net increase in purchases of marketable investment securities, a decrease in proceeds from the sale of investments and
an increase in cash used for the purchases of strategic investments. The overall net increases were partially offset by
cash used for purchases of FCC licenses during 2008 and a decrease in cash used for purchases of property and
equipment during 2009 compared to 2008.