Dish Network 2010 Annual Report Download - page 56
Download and view the complete annual report
Please find page 56 of the 2010 Dish Network annual report below. You can navigate through the pages in the report by either clicking on the pages listed below, or by using the keyword search tool below to find specific information within the annual report.-
 1
1 -
2
-
3
-
4
-
5
-
6
-
7
-
8
-
9
-
10
-
11
-
12
-
13
-
14
-
15
-
16
-
17
-
18
-
19
-
20
-
21
-
22
-
23
-
24
-
25
-
26
-
27
-
28
-
29
-
30
-
31
-
32
-
33
-
34
-
35
-
36
-
37
-
38
-
39
-
40
-
41
-
42
-
43
-
44
-
45
-
 46
46 -
 47
47 -
 48
48 -
 49
49 -
 50
50 -
 51
51 -
 52
52 -
 53
53 -
 54
54 -
 55
55 -
 56
56 -
 57
57 -
 58
58 -
 59
59 -
 60
60 -
 61
61 -
 62
62 -
 63
63 -
 64
64 -
 65
65 -
 66
66 -
67
-
68
-
69
-
70
-
71
-
72
-
73
-
74
-
75
-
76
-
77
-
78
-
79
-
80
-
81
-
82
-
83
-
84
-
85
-
86
-
87
-
88
-
89
-
90
-
91
-
92
-
93
-
94
-
95
-
96
-
97
-
98
-
99
-
100
-
101
-
102
-
103
-
104
-
105
-
106
-
107
-
108
-
109
-
110
-
111
-
112
-
113
-
114
-
115
-
116
-
117
-
118
-
119
-
120
-
121
-
122
-
123
-
124
-
125
-
126
-
127
-
128
-
129
-
130
-
131
-
132
-
133
-
134
-
135
-
136
-
137
-
138
-
139
-
140
-
141
-
142
-
143
-
144
-
145
-
146
-
147
-
148
 |
 |
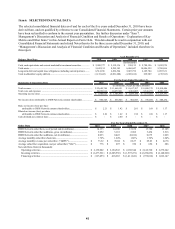
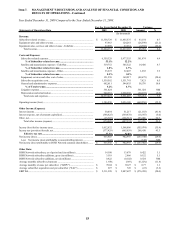
Item 7. MANAGEMENT’S DISCUSSION AND ANALYSIS OF FINANCIAL CONDITION AND
RESULTS OF OPERATIONS - Continued
49
49
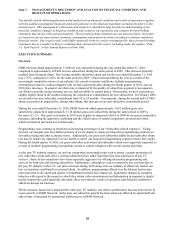
DISH Network subscribers. As of December 31, 2010, we had approximately 14.133 million DISH Network
subscribers compared to approximately 14.100 million subscribers at December 31, 2009, an increase of 0.2%.
During the year ended December 31, 2010, DISH Network added approximately 3.052 million gross new
subscribers compared to approximately 3.118 million gross new subscribers during the same period in 2009, a
decrease of 2.1%. Our gross activations in 2010 were negatively impacted relative to 2009 by increased competitive
pressures, including the aggressive marketing and the effectiveness of certain competitors’ promotional offers,
which included an increased level of discounts. DISH Network added approximately 33,000 net new subscribers
during the year ended December 31, 2010, compared to approximately 422,000 net new subscribers during the same
period in 2009. This decrease primarily resulted from increased churn.
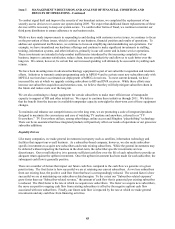
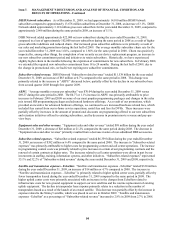
Our average monthly subscriber churn rate for the year ended December 31, 2010 was 1.76%, compared to 1.64%
for the same period in 2009. Churn increased during the year as a result of the increasingly competitive nature of
our industry, the current economic conditions, multiple programming interruptions related to contract disputes with
several content providers during the fourth quarter of 2010, and our 2010 price increases. In general, our churn rate
is impacted by the quality of subscribers acquired in past quarters, our ability to provide strong customer service,
and our ability to control piracy. Historically, we have experienced slightly higher churn in the months following
the expiration of commitments for new subscribers. In February 2008, we extended our new subscriber commitment
from 18 to 24 months. Consequently, during the second half of 2009, churn was positively impacted by, among
other things, this increase in our new subscriber commitment period.
When the size of our subscriber base increases, even if our subscriber churn rate remains constant, increasing numbers
of gross new DISH Network subscribers are required to sustain net subscriber growth.
We have not always met our own standards for performing high-quality installations, effectively resolving subscriber
issues when they arise, answering subscriber calls in an acceptable timeframe, effectively communicating with our
subscriber base, reducing calls driven by the complexity of our business, improving the reliability of certain systems
and subscriber equipment, and aligning the interests of certain third party retailers and installers to provide high-quality
service. Most of these factors have affected both gross new subscriber additions as well as existing subscriber churn.
Our future gross new subscriber additions and subscriber churn may be negatively impacted by these factors, which
could in turn adversely affect our revenue growth.
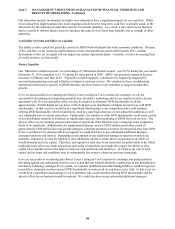
Subscriber-related revenue. DISH Network “Subscriber-related revenue” totaled $12.544 billion for the year ended
December 31, 2010, an increase of $1.005 billion or 8.7% compared to the same period in 2009. This change was
primarily related to the increase in “ARPU” discussed below as well as a larger average subscriber base during the
year ended December 31, 2010 compared to the same period in 2009.
ARPU. “Average monthly revenue per subscriber” was $73.32 during the year ended December 31, 2010 versus
$70.04 during the same period in 2009. The $3.28 or 4.7% increase in ARPU was primarily attributable to price
increases in February and June 2010 and changes in the sales mix toward more advanced hardware offerings.
ARPU increased as a result of higher hardware related fees which include rental fees, fees earned from our in-home
service operations, and fees for DVRs. This increase was partially offset by increases in the amount of promotional
discounts on programming offered to our new subscribers.
Equipment sales and other revenue. “Equipment sales and other revenue” totaled $60 million during the year ended
December 31, 2010, a decrease of $38 million or 38.9% compared to the same period in 2009. The decrease in
“Equipment sales and other revenue” primarily resulted from a decline in the sales of non-subsidized DBS receivers
and accessories, and digital converter boxes in 2010 compared to the same period in 2009.