Dish Network 2010 Annual Report Download - page 61
Download and view the complete annual report
Please find page 61 of the 2010 Dish Network annual report below. You can navigate through the pages in the report by either clicking on the pages listed below, or by using the keyword search tool below to find specific information within the annual report.-
 1
1 -
2
-
3
-
4
-
5
-
6
-
7
-
8
-
9
-
10
-
11
-
12
-
13
-
14
-
15
-
16
-
17
-
18
-
19
-
20
-
21
-
22
-
23
-
24
-
25
-
26
-
27
-
28
-
29
-
30
-
31
-
32
-
33
-
34
-
35
-
36
-
37
-
38
-
39
-
40
-
41
-
42
-
43
-
44
-
45
-
46
-
47
-
48
-
49
-
50
-
 51
51 -
 52
52 -
 53
53 -
 54
54 -
 55
55 -
 56
56 -
 57
57 -
 58
58 -
 59
59 -
 60
60 -
 61
61 -
 62
62 -
 63
63 -
 64
64 -
 65
65 -
 66
66 -
 67
67 -
 68
68 -
 69
69 -
 70
70 -
 71
71 -
72
-
73
-
74
-
75
-
76
-
77
-
78
-
79
-
80
-
81
-
82
-
83
-
84
-
85
-
86
-
87
-
88
-
89
-
90
-
91
-
92
-
93
-
94
-
95
-
96
-
97
-
98
-
99
-
100
-
101
-
102
-
103
-
104
-
105
-
106
-
107
-
108
-
109
-
110
-
111
-
112
-
113
-
114
-
115
-
116
-
117
-
118
-
119
-
120
-
121
-
122
-
123
-
124
-
125
-
126
-
127
-
128
-
129
-
130
-
131
-
132
-
133
-
134
-
135
-
136
-
137
-
138
-
139
-
140
-
141
-
142
-
143
-
144
-
145
-
146
-
147
-
148
 |
 |
Item 7. MANAGEMENT’S DISCUSSION AND ANALYSIS OF FINANCIAL CONDITION AND
RESULTS OF OPERATIONS - Continued
54
54
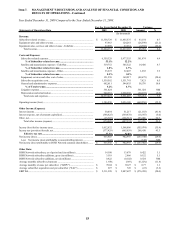
DISH Network subscribers. As of December 31, 2009, we had approximately 14.100 million DISH Network
subscribers compared to approximately 13.678 million subscribers at December 31, 2008, an increase of 3.1%. DISH
Network added approximately 3.118 million gross new subscribers for the year ended December 31, 2009, compared to
approximately 2.966 million during the same period in 2008, an increase of 5.1%.
DISH Network added approximately 422,000 net new subscribers during the year ended December 31, 2009,
compared to a loss of approximately 102,000 net new subscribers during the same period in 2008 as a result of higher
gross subscriber additions and reduced churn. Our increased gross subscriber additions were primarily a result of
our sales and marketing promotions during the last half of 2009. Our average monthly subscriber churn rate for the
year ended December 31, 2009 was 1.64%, compared to 1.86% for the same period in 2008. Churn was positively
impacted by, among other things, the completion of our security access device replacement program, an increase in
our new subscriber commitment period and initiatives to retain subscribers. Historically, we have experienced
slightly higher churn in the months following the expiration of commitments for new subscribers. In February 2008,
we extended the required new subscriber commitment from 18 to 24 months. During the last half of 2009, due to
the change in promotional mix, we had fewer expiring new subscriber commitments.
Subscriber-related revenue. DISH Network “Subscriber-related revenue” totaled $11.539 billion for the year ended
December 31, 2009, an increase of $83 million or 0.7% compared to the same period in 2008. This change was
primarily related to the increase in “ARPU” discussed below, partially offset by the decline in our subscriber base
from second quarter 2008 through first quarter 2009.
ARPU. “Average monthly revenue per subscriber” was $70.04 during the year ended December 31, 2009 versus
$69.27 during the same period in 2008. The $0.77 or 1.1% increase in ARPU was primarily attributable to price
increases in February 2009 and 2008 on some of our most popular programming packages and changes in the sales
mix toward HD programming packages and advanced hardware offerings. As a result of our promotions, which
provided an incentive for advanced hardware offerings, we continued to see increased hardware related fees, which
included fees earned from our in-home service operations, rental fees and fees for DVRs. These increases were
partially offset by increases in the amount of promotional discounts on programming offered to our new subscribers
and retention initiatives offered to existing subscribers, and by decreases in premium movie revenue and pay-per-
view buys.
Equipment sales and other revenue. “Equipment sales and other revenue” totaled $98 million during the year ended
December 31, 2009, a decrease of $26 million or 21.2% compared to the same period during 2008. The decrease in
“Equipment sales and other revenue” primarily resulted from a decrease in sales of non-subsidized DBS accessories.
Subscriber-related expenses. “Subscriber-related expenses” totaled $6.359 billion during the year ended December
31, 2009, an increase of $382 million or 6.4% compared to the same period 2008. The increase in “Subscriber-related
expenses” was primarily attributable to higher costs for programming content and call center operations. The increase
in programming content costs was primarily related to price increases in certain of our programming contracts and the
renewal of certain contracts at higher rates. The increases related to call center operations were driven in part by our
investments in staffing, training, information systems, and other initiatives. “Subscriber-related expenses” represented
55.1% and 52.2% of “Subscriber-related revenue” during the years ended December 31, 2009 and 2008, respectively.
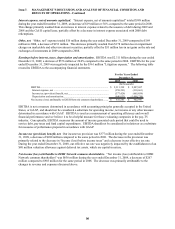
Satellite and transmission expenses - EchoStar. “Satellite and transmission expenses - EchoStar” totaled $320 million
during the year ended December 31, 2009, an increase of $14 million or 4.7% compared to 2008. The increase in
“Satellite and transmission expenses – EchoStar” is primarily related to higher uplink center costs, partially offset by
fewer transponders leased during the year ended December 31, 2009 compared to the same period in 2008. The
higher uplink center costs were primarily associated with an increase in the charges from EchoStar related to
infrastructure costs for new ground equipment to support our new satellites and the routine replacement of existing
uplink equipment. The decline in transponder lease expense primarily relates to a reduction in the number of
transponders leased as a result of the launch of an owned satellite. This decrease was partially offset by the increase in
expense related to the Nimiq 5 satellite, which was placed in service in October 2009. “Satellite and transmission
expenses - EchoStar” as a percentage of “Subscriber-related revenue” increased to 2.8% in 2009 from 2.7% in 2008.