Dish Network 2008 Annual Report Download - page 64
Download and view the complete annual report
Please find page 64 of the 2008 Dish Network annual report below. You can navigate through the pages in the report by either clicking on the pages listed below, or by using the keyword search tool below to find specific information within the annual report.-
 1
1 -
2
-
3
-
4
-
5
-
6
-
7
-
8
-
9
-
10
-
11
-
12
-
13
-
14
-
15
-
16
-
17
-
18
-
19
-
20
-
21
-
22
-
23
-
24
-
25
-
26
-
27
-
28
-
29
-
30
-
31
-
32
-
33
-
34
-
35
-
36
-
37
-
38
-
39
-
40
-
41
-
42
-
43
-
44
-
45
-
46
-
47
-
48
-
49
-
50
-
51
-
52
-
53
-
 54
54 -
 55
55 -
 56
56 -
 57
57 -
 58
58 -
 59
59 -
 60
60 -
 61
61 -
 62
62 -
 63
63 -
 64
64 -
 65
65 -
 66
66 -
 67
67 -
 68
68 -
 69
69 -
 70
70 -
 71
71 -
 72
72 -
 73
73 -
 74
74 -
75
-
76
-
77
-
78
-
79
-
80
-
81
-
82
-
83
-
84
-
85
-
86
-
87
-
88
-
89
-
90
-
91
-
92
-
93
-
94
-
95
-
96
-
97
-
98
-
99
-
100
-
101
-
102
-
103
-
104
-
105
-
106
-
107
-
108
-
109
-
110
-
111
-
112
-
113
-
114
-
115
-
116
-
117
-
118
-
119
-
120
-
121
-
122
-
123
-
124
-
125
-
126
-
127
-
128
-
129
-
130
-
131
-
132
-
133
-
134
-
135
-
136
-
137
-
138
-
139
-
140
-
141
-
142
-
143
-
144
 |
 |

Item 7. MANAGEMENT’S DISCUSSION AND ANALYSIS OF FINANCIAL CONDITION AND
RESULTS OF OPERATIONS - Continued
54
LIQUIDITY AND CAPITAL RESOURCES
Cash, cash equivalents and marketable investment securities. We consider all liquid investments purchased within
90 days of their maturity to be cash equivalents. See “Item 7A. – Quantitative and Qualitative Disclosures About
Market Risk” for further discussion regarding our marketable investment securities. As of December 31, 2008, our
cash, cash equivalents and current marketable investment securities totaled $559 million compared to $2.788 billion
as of December 31, 2007, a decrease of $2.229 billion.
Our principal source of liquidity during 2008 was cash generated by operating activities of $2.188 billion,
approximately $750 million raised in issuing our 7 ¾% Senior Notes due 2015 and the net sales of marketable and
strategic investments of $166 million. Our primary uses of cash during 2008 were for the redemption of $1.5 billion of
debt, the purchases of property and equipment of $1.130 billion, the acquisition of 700 MHz wireless spectrum for
$712 million, the distribution of $1.532 billion to EchoStar related to the Spin-off, and the repurchase of 3.1 million
shares of our common stock for $83 million. In addition, we reclassified $240 million of marketable investment
securities on hand at December 31, 2007 to noncurrent assets during 2008 as recent events in the credit markets have
reduced or eliminated current liquidity for these investments.
The following discussion highlights our free cash flow and cash flow activities during the years ended December 31,
2008, 2007 and 2006.
Free cash flow. We define free cash flow as “Net cash flows from operating activities” less “Purchases of property
and equipment,” as shown on our Consolidated Statements of Cash Flows. We believe free cash flow is an
important liquidity metric because it measures, during a given period, the amount of cash generated that is available
to repay debt obligations, make investments, fund acquisitions and for certain other activities. Free cash flow is not
a measure determined in accordance with GAAP and should not be considered a substitute for “Operating income,”
“Net income,” “Net cash flows from operating activities” or any other measure determined in accordance with
GAAP. Since free cash flow includes investments in operating assets, we believe this non-GAAP liquidity measure
is useful in addition to the most directly comparable GAAP measure - “Net cash flows from operating activities.”
During the years ended December 31, 2008, 2007 and 2006, free cash flow was significantly impacted by changes in
operating assets and liabilities as shown in the “Net cash flows from operating activities” section of our Consolidated
Statements of Cash Flows included herein. Operating asset and liability balances can fluctuate significantly from
period to period and there can be no assurance that free cash flow will not be negatively impacted by material changes
in operating assets and liabilities in future periods, since these changes depend upon, among other things,
management’s timing of payments and control of inventory levels, and cash receipts. In addition to fluctuations
resulting from changes in operating assets and liabilities, free cash flow can vary significantly from period to period
depending upon, among other things, subscriber growth, subscriber revenue, subscriber churn, subscriber acquisition
costs including amounts capitalized under our equipment lease programs, operating efficiencies, increases or decreases
in purchases of property and equipment and other factors.
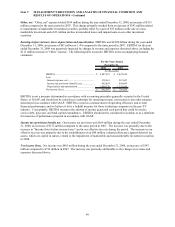
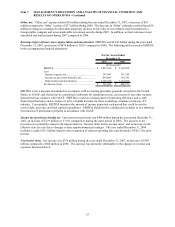
The following table reconciles free cash flow to “Net cash flows from operating activities.”
2008 2007 2006
Free cash flow........................................................... 1,058,454$ 1,172,198$ 882,924$
Add back:
Purchases of property and equipment................... 1,129,890 1,444,522 1,396,318
Net cash flows from operating activities................... 2,188,344$ 2,616,720$ 2,279,242$
For the Years Ended December 31,
(In thousands)
The decline in free cash flow from 2007 to 2008 of $114 million resulted from a decrease in “Net cash flows from
operating activities” of $429 million, or 16.4%, partially offset by a decrease in “Purchases of property and equipment”
of $315 million, or 21.8%. The decrease in “Net cash flows from operating activities” was primarily attributable to a
$351 million decrease in cash resulting from changes in operating assets and liabilities and a $59 million decrease in
net income, adjusted to exclude non-cash changes in “Depreciation and amortization” expense and “Realized and