Dish Network 2008 Annual Report Download - page 63
Download and view the complete annual report
Please find page 63 of the 2008 Dish Network annual report below. You can navigate through the pages in the report by either clicking on the pages listed below, or by using the keyword search tool below to find specific information within the annual report.-
 1
1 -
2
-
3
-
4
-
5
-
6
-
7
-
8
-
9
-
10
-
11
-
12
-
13
-
14
-
15
-
16
-
17
-
18
-
19
-
20
-
21
-
22
-
23
-
24
-
25
-
26
-
27
-
28
-
29
-
30
-
31
-
32
-
33
-
34
-
35
-
36
-
37
-
38
-
39
-
40
-
41
-
42
-
43
-
44
-
45
-
46
-
47
-
48
-
49
-
50
-
51
-
52
-
 53
53 -
 54
54 -
 55
55 -
 56
56 -
 57
57 -
 58
58 -
 59
59 -
 60
60 -
 61
61 -
 62
62 -
 63
63 -
 64
64 -
 65
65 -
 66
66 -
 67
67 -
 68
68 -
 69
69 -
 70
70 -
 71
71 -
 72
72 -
 73
73 -
74
-
75
-
76
-
77
-
78
-
79
-
80
-
81
-
82
-
83
-
84
-
85
-
86
-
87
-
88
-
89
-
90
-
91
-
92
-
93
-
94
-
95
-
96
-
97
-
98
-
99
-
100
-
101
-
102
-
103
-
104
-
105
-
106
-
107
-
108
-
109
-
110
-
111
-
112
-
113
-
114
-
115
-
116
-
117
-
118
-
119
-
120
-
121
-
122
-
123
-
124
-
125
-
126
-
127
-
128
-
129
-
130
-
131
-
132
-
133
-
134
-
135
-
136
-
137
-
138
-
139
-
140
-
141
-
142
-
143
-
144
 |
 |

Item 7. MANAGEMENT’S DISCUSSION AND ANALYSIS OF FINANCIAL CONDITION AND
RESULTS OF OPERATIONS - Continued
53
Other, net. “Other, net” expense totaled $56 million during the year ended December 31, 2007, a decrease of $93
million compared to “Other” income of $37 million during 2006. The decrease in “Other” primarily resulted from $56
million in charges to earnings for other-than-temporary declines in fair value of our common stock investment in a
foreign public company and a non-marketable investment security during 2007. In addition, we had a decrease in net
unrealized and realized gains during 2007 compared to 2006.
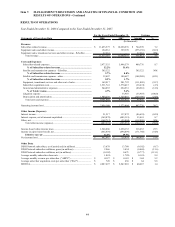
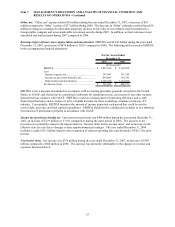
Earnings before interest, taxes, depreciation and amortization. EBITDA was $2.847 billion during the year ended
December 31, 2007, an increase of $478 million or 20.2% compared to 2006. The following table reconciles EBITDA
to the accompanying financial statements:
2007 2006
EBITDA................................................................ 2,847,010$ 2,369,058$
Less:
Interest expense, net ........................................... 267,447 331,749
Income tax provision (benefit), net...................... 494,099 314,743
Depreciation and amortization............................ 1,329,410 1,114,294
Net income (loss).................................................. 756,054$ 608,272$
For the Years Ended
December 31,
(In thousands)
EBITDA is not a measure determined in accordance with accounting principles generally accepted in the United
States, or GAAP, and should not be considered a substitute for operating income, net income or any other measure
determined in accordance with GAAP. EBITDA is used as a measurement of operating efficiency and overall
financial performance and we believe it to be a helpful measure for those evaluating companies in the pay-TV
industry. Conceptually, EBITDA measures the amount of income generated each period that could be used to
service debt, pay taxes and fund capital expenditures. EBITDA should not be considered in isolation or as a substitute
for measures of performance prepared in accordance with GAAP.
Income tax (provision) benefit, net. Our income tax provision was $494 million during the year ended December 31,
2007, an increase of $179 million or 57.0% compared to during the same period in 2006. The increase in the
provision was primarily related to the improvement in “Income (loss) before income taxes” and an increase in the
effective state tax rate due to changes in state apportionment percentages. The year ended December 31, 2006
includes a credit of $13 million related to the recognition of state net operating loss carryforwards (“NOLs”) for prior
periods.
Net income (loss). Net income was $756 million during the year ended December 31, 2007, an increase of $148
million compared to $608 million in 2006. The increase was primarily attributable to the changes in revenue and
expenses discussed above.