Dish Network 2008 Annual Report Download - page 104
Download and view the complete annual report
Please find page 104 of the 2008 Dish Network annual report below. You can navigate through the pages in the report by either clicking on the pages listed below, or by using the keyword search tool below to find specific information within the annual report.-
 1
1 -
2
-
3
-
4
-
5
-
6
-
7
-
8
-
9
-
10
-
11
-
12
-
13
-
14
-
15
-
16
-
17
-
18
-
19
-
20
-
21
-
22
-
23
-
24
-
25
-
26
-
27
-
28
-
29
-
30
-
31
-
32
-
33
-
34
-
35
-
36
-
37
-
38
-
39
-
40
-
41
-
42
-
43
-
44
-
45
-
46
-
47
-
48
-
49
-
50
-
51
-
52
-
53
-
54
-
55
-
56
-
57
-
58
-
59
-
60
-
61
-
62
-
63
-
64
-
65
-
66
-
67
-
68
-
69
-
70
-
71
-
72
-
73
-
74
-
75
-
76
-
77
-
78
-
79
-
80
-
81
-
82
-
83
-
84
-
85
-
86
-
87
-
88
-
89
-
90
-
91
-
92
-
93
-
 94
94 -
 95
95 -
 96
96 -
 97
97 -
 98
98 -
 99
99 -
 100
100 -
 101
101 -
 102
102 -
 103
103 -
 104
104 -
 105
105 -
 106
106 -
 107
107 -
 108
108 -
 109
109 -
 110
110 -
 111
111 -
 112
112 -
 113
113 -
 114
114 -
115
-
116
-
117
-
118
-
119
-
120
-
121
-
122
-
123
-
124
-
125
-
126
-
127
-
128
-
129
-
130
-
131
-
132
-
133
-
134
-
135
-
136
-
137
-
138
-
139
-
140
-
141
-
142
-
143
-
144
 |
 |

DISH NETWORK CORPORATION
NOTES TO CONSOLIDATED FINANCIAL STATEMENTS - Continued
F-22
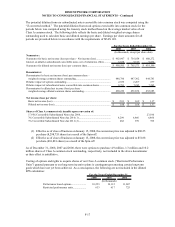
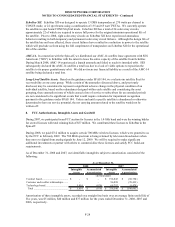
Our assets measured at fair value on a recurring basis were as follows (in thousands):
Assets
Total Level 1 Level 2 Level 3
Marketable investment securities............
596,359$ 16,029$ 475,974$ 104,356$
Other investment securities.....................
2,323 - - 2,323
Total assets at fair value.......................
598,682$ 16,029$ 475,974$ 106,679$
2008
(In thousands)
Total Fair Value As of December 31,
Changes in Level 3 instruments are as follows (in thousands):
Total
Current and
Noncurrent
Marketable
Investment
Securities
Other
Investment
Securities
Balance as of January 1, 2008................................................................................... 211,999$ 200,595$ 11,404$
Transfers in (out) of level 3, net................................................................................... 21,262 21,262 -
Net realized/unrealized gains/(losses) included in earnings......................................... (10,152) (1,071) (9,081)
Net realized/unrealized gains/(losses) included in other comprehensive income......... (107,851) (107,851) -
Purchases, issuances and settlements, net ................................................................... (8,579) (8,579) -
Balance as of December 31, 2008.............................................................................. 106,679$ 104,356$ 2,323$
Level 3
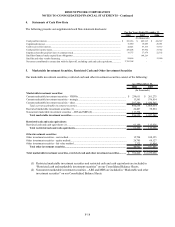
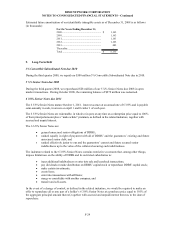
Gains and Losses on Sales and Changes in Carrying Values of Investments
“Other, net” income and expense included on our Consolidated Statements of Operations and Comprehensive
Income (Loss) includes other changes in the carrying amount of our marketable and non-marketable
investments as follows:
Other Income (Expense): 2008 2007 2006
Marketable investment securities - gains (losses) on sales/exchange............... $ 2,095 $ 13,608 $ 30,302
Marketable investment securities - other-than-temporary impairments ........... (191,404) - -
Other investment securities - gains (losses) on sales/exchanges....................... 53,473 8,358 58,345
Other investment securities - unrealized gains (losses) on fair value
investments and other-than-temporary impairments .................................... (33,534) (66,733) (32,928)
Other................................................................................................................ 657 (11,037) (18,326)
Total................................................................................................................ (168,713)$ (55,804)$ 37,393$
For the Years Ended December 31,
(In thousands)