Dish Network 2008 Annual Report Download - page 48
Download and view the complete annual report
Please find page 48 of the 2008 Dish Network annual report below. You can navigate through the pages in the report by either clicking on the pages listed below, or by using the keyword search tool below to find specific information within the annual report.-
 1
1 -
2
-
3
-
4
-
5
-
6
-
7
-
8
-
9
-
10
-
11
-
12
-
13
-
14
-
15
-
16
-
17
-
18
-
19
-
20
-
21
-
22
-
23
-
24
-
25
-
26
-
27
-
28
-
29
-
30
-
31
-
32
-
33
-
34
-
35
-
36
-
37
-
 38
38 -
 39
39 -
 40
40 -
 41
41 -
 42
42 -
 43
43 -
 44
44 -
 45
45 -
 46
46 -
 47
47 -
 48
48 -
 49
49 -
 50
50 -
 51
51 -
 52
52 -
 53
53 -
 54
54 -
 55
55 -
 56
56 -
 57
57 -
 58
58 -
59
-
60
-
61
-
62
-
63
-
64
-
65
-
66
-
67
-
68
-
69
-
70
-
71
-
72
-
73
-
74
-
75
-
76
-
77
-
78
-
79
-
80
-
81
-
82
-
83
-
84
-
85
-
86
-
87
-
88
-
89
-
90
-
91
-
92
-
93
-
94
-
95
-
96
-
97
-
98
-
99
-
100
-
101
-
102
-
103
-
104
-
105
-
106
-
107
-
108
-
109
-
110
-
111
-
112
-
113
-
114
-
115
-
116
-
117
-
118
-
119
-
120
-
121
-
122
-
123
-
124
-
125
-
126
-
127
-
128
-
129
-
130
-
131
-
132
-
133
-
134
-
135
-
136
-
137
-
138
-
139
-
140
-
141
-
142
-
143
-
144
 |
 |

38
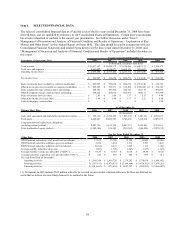
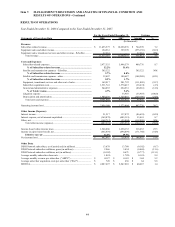
Item 6. SELECTED FINANCIAL DATA
The selected consolidated financial data as of and for each of the five years ended December 31, 2008 have been
derived from, and are qualified by reference to our Consolidated Financial Statements. Certain prior year amounts
have been reclassified to conform to the current year presentation. See further discussion under “Item 7.
Management’s Discussion and Analysis of Financial Condition and Results of Operations – Explanation of Key
Metrics and Other Items” in this Annual Report on Form 10-K. This data should be read in conjunction with our
Consolidated Financial Statements and related Notes thereto for the three years ended December 31, 2008, and
“Management’s Discussion and Analysis of Financial Condition and Results of Operations” included elsewhere in
this report.
Statements of Operations Data 2008 2007 2006 2005 2004
Total revenue ....................................................................................... 11,617,187$ 11,090,375$ 9,818,486$ 8,447,175$ 7,158,471$
Total costs and expenses .................................................................... 9,561,007 9,516,971 8,601,115 7,279,927 6,455,166
Operating income (loss) ...................................................................... 2,056,180$ 1,573,404$ 1,217,371$ 1,167,248$ 703,305$
Net income (loss) ............................................................................... 902,947$ 756,054$ 608,272$ 1,514,540$ (1) 214,769$
Basic net income (loss) available to common stockholders ............... 902,947$ 756,054$ 608,272$ 1,514,540$ 214,769$
Diluted net income (loss) available to common stockholders ............ 909,585$ 765,571$ 618,106$ 1,560,688$ (1) 214,769$
Basic weighted-average common shares outstanding........................... 448,786 447,302 444,743 452,118 464,053
Diluted weighted-average common shares outstanding........................ 460,226 456,834 452,685 484,131 467,598
Basic net income (loss) per share ........................................................ 2.01$ 1.69$ 1.37$ 3.35$ 0.46$
Diluted net income (loss) per share ..................................................... 1.98$ 1.68$ 1.37$ 3.22$ 0.46$
Cash dividend per common share......................................................... -$ -$ -$ -$ 1.00$
For the Years Ended December 31,
(In thousands, except per share data)
Balance Sheet Data 2008 2007 2006 2005 2004
Cash, cash equivalents and marketable investment securities.............. 559,132$ 2,788,196$ 3,032,570$ 1,181,361$ 1,155,633$
Total assets........................................................................................... 6,460,047 10,086,529 9,768,696 7,410,210 6,029,277
Long-term debt and capital lease obligations
(including current portion)…………………………………………… 5,007,756 6,125,704 6,967,321 5,935,301 5,791,561
Total stockholders' equity (deficit)....................................................... (1,949,106) 639,989 (219,383) (866,624) (2,078,212)
As of December 31,
(In thousands)
Other Data 2008 2007 2006 2005 2004
DISH Network subscribers, as of period end (in millions)................... 13.678 13.780 13.105 12.040 10.905
DISH Network subscriber additions, gross (in millions)...................... 2.966 3.434 3.516 3.397 3.441
DISH Network subscriber additions, net (in millions)......................... (0.102) 0.675 1.065 1.135 1.480
Average monthly subscriber churn rate................................................ 1.86% 1.70% 1.64% 1.65% 1.62%
Average monthly revenue per subscriber ("ARPU")........................... 69.27$ 65.83$ 62.78$ 58.34$ 55.26$
Average subscriber acquisition costs per subscriber ("SAC").............. 720$ 656$ 686$ 693$ 611$
Net cash flows from (in thousands):
Operating activities ........................................................................ 2,188,344$ 2,616,720$ 2,279,242$ 1,774,074$ 1,001,442$
Investing activities .......................................................................... (1,597,471)$ (2,470,832)$ (2,148,968)$ (1,478,762)$ 1,078,281$
Financing activities ......................................................................... (1,411,841)$ (976,016)$ 1,022,147$ (402,623)$ (2,666,022)$
For the Years Ended December 31,
(1) Net income in 2005 includes $915 million related to the reversal of our recorded valuation allowance for those net deferred tax
assets that we believe are more likely than not to be realized in the future.