Dish Network 2008 Annual Report Download - page 135
Download and view the complete annual report
Please find page 135 of the 2008 Dish Network annual report below. You can navigate through the pages in the report by either clicking on the pages listed below, or by using the keyword search tool below to find specific information within the annual report.-
 1
1 -
2
-
3
-
4
-
5
-
6
-
7
-
8
-
9
-
10
-
11
-
12
-
13
-
14
-
15
-
16
-
17
-
18
-
19
-
20
-
21
-
22
-
23
-
24
-
25
-
26
-
27
-
28
-
29
-
30
-
31
-
32
-
33
-
34
-
35
-
36
-
37
-
38
-
39
-
40
-
41
-
42
-
43
-
44
-
45
-
46
-
47
-
48
-
49
-
50
-
51
-
52
-
53
-
54
-
55
-
56
-
57
-
58
-
59
-
60
-
61
-
62
-
63
-
64
-
65
-
66
-
67
-
68
-
69
-
70
-
71
-
72
-
73
-
74
-
75
-
76
-
77
-
78
-
79
-
80
-
81
-
82
-
83
-
84
-
85
-
86
-
87
-
88
-
89
-
90
-
91
-
92
-
93
-
94
-
95
-
96
-
97
-
98
-
99
-
100
-
101
-
102
-
103
-
104
-
105
-
106
-
107
-
108
-
109
-
110
-
111
-
112
-
113
-
114
-
115
-
116
-
117
-
118
-
119
-
120
-
121
-
122
-
123
-
124
-
 125
125 -
 126
126 -
 127
127 -
 128
128 -
 129
129 -
 130
130 -
 131
131 -
 132
132 -
 133
133 -
 134
134 -
 135
135 -
 136
136 -
 137
137 -
 138
138 -
 139
139 -
 140
140 -
 141
141 -
 142
142 -
 143
143 -
 144
144
 |
 |

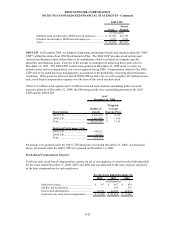
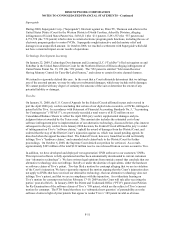
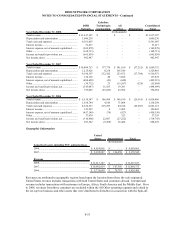
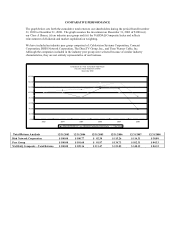
DISH NETWORK CORPORATION
NOTES TO CONSOLIDATED FINANCIAL STATEMENTS - Continued
F-53
EchoStar
DISH Technologies All Consolidated
Network Corporation Other Eliminations Total
Year Ended December 31, 2008
Total revenue ....................................................... 11,617,187$ -$ -$ -$ 11,617,187$
Depreciation and amortization ............................. 1,000,230 - - - 1,000,230
Total costs and expenses ...................................... 9,561,007 - - - 9,561,007
Interest income .................................................... 51,217 - - - 51,217
Interest expense, net of amounts capitalized ........ (369,878) - - - (369,878)
Other..................................................................... (168,713) - - - (168,713)
Income tax benefit (provision), net ...................... (665,859) - - - (665,859)
Net income (loss) ................................................. 902,947 - - - 902,947
Year Ended December 31, 2007
Total revenue ....................................................... 10,808,753$ 177,774$ 141,100$ (37,252)$ 11,090,375$
Depreciation and amortization ............................. 1,215,626 8,238 105,546 - 1,329,410
Total costs and expenses ...................................... 9,198,397 232,382 123,972 (37,780) 9,516,971
Interest income .................................................... 134,136 40 3,696 - 137,872
Interest expense, net of amounts capitalized ........ (404,628) (43) (648) - (405,319)
Other..................................................................... (39,732) 23 (15,567) (528) (55,804)
Income tax benefit (provision), net ...................... (545,047) 31,565 19,383 - (494,099)
Net income (loss) ................................................. 755,085 (23,023) 23,992 - 756,054
Year Ended December 31, 2006
Total revenue ....................................................... 9,514,347$ 186,984$ 146,190$ (29,035)$ 9,818,486$
Depreciation and amortization ............................. 1,038,744 4,546 71,004 - 1,114,294
Total costs and expenses ...................................... 8,326,513 219,299 84,338 (29,035) 8,601,115
Interest income .................................................... 123,995 4 2,402 - 126,401
Interest expense, net of amounts capitalized ........ (457,149) (74) (927) - (458,150)
Other..................................................................... 37,070 - 323 - 37,393
Income tax benefit (provision), net ...................... (310,408) 22,887 (27,222) - (314,743)
Net income (loss) ................................................. 581,342 (9,498) 36,428 - 608,272
(In thousands)
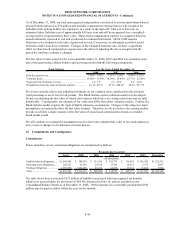
Geographic Information
United
States International Total
Long-lived assets, including FCC authorizations
2008............................................................................. 4,059,865$ -$ 4,059,865$
2007............................................................................. 5,182,587$ 196,958$ 5,379,545$
Revenue
2008............................................................................. 11,617,187$ -$ 11,617,187$
2007............................................................................. 10,982,419$ 107,956$ 11,090,375$
2006............................................................................. 9,739,699$ 78,787$ 9,818,486$
(In thousands)
Revenues are attributed to geographic regions based upon the location from where the sale originated.
United States revenue includes transactions with both United States and customers abroad. International
revenue includes transactions with customers in Europe, Africa, South America and the Middle East. Prior
to 2008, revenues from these customers are included within the All Other operating segment and related to
the set-top box business and other assets that were distributed to EchoStar in connection with the Spin-off.