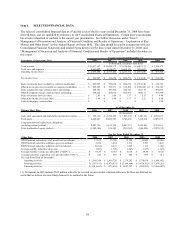
Dish Network 2008 Annual Report Download - page 53
Download and view the complete annual report
Please find page 53 of the 2008 Dish Network annual report below. You can navigate through the pages in the report by either clicking on the pages listed below, or by using the keyword search tool below to find specific information within the annual report.-
 1
1 -
2
-
3
-
4
-
5
-
6
-
7
-
8
-
9
-
10
-
11
-
12
-
13
-
14
-
15
-
16
-
17
-
18
-
19
-
20
-
21
-
22
-
23
-
24
-
25
-
26
-
27
-
28
-
29
-
30
-
31
-
32
-
33
-
34
-
35
-
36
-
37
-
38
-
39
-
40
-
41
-
42
-
 43
43 -
 44
44 -
 45
45 -
 46
46 -
 47
47 -
 48
48 -
 49
49 -
 50
50 -
 51
51 -
 52
52 -
 53
53 -
 54
54 -
 55
55 -
 56
56 -
 57
57 -
 58
58 -
 59
59 -
 60
60 -
 61
61 -
 62
62 -
 63
63 -
64
-
65
-
66
-
67
-
68
-
69
-
70
-
71
-
72
-
73
-
74
-
75
-
76
-
77
-
78
-
79
-
80
-
81
-
82
-
83
-
84
-
85
-
86
-
87
-
88
-
89
-
90
-
91
-
92
-
93
-
94
-
95
-
96
-
97
-
98
-
99
-
100
-
101
-
102
-
103
-
104
-
105
-
106
-
107
-
108
-
109
-
110
-
111
-
112
-
113
-
114
-
115
-
116
-
117
-
118
-
119
-
120
-
121
-
122
-
123
-
124
-
125
-
126
-
127
-
128
-
129
-
130
-
131
-
132
-
133
-
134
-
135
-
136
-
137
-
138
-
139
-
140
-
141
-
142
-
143
-
144
 |
 |
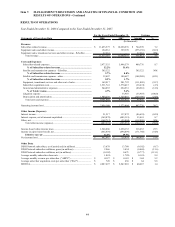
Item 7. MANAGEMENT’S DISCUSSION AND ANALYSIS OF FINANCIAL CONDITION AND
RESULTS OF OPERATIONS - Continued
43
capitalized equipment) as our management believes it is a more comprehensive measure of how much we are
spending to acquire subscribers. We also include all new DISH Network subscribers in our calculation, including
DISH Network subscribers added with little or no subscriber acquisition costs.
General and administrative expenses. “General and administrative expenses” consists primarily of employee-
related costs associated with administrative services such as legal, information systems, accounting and finance,
including non-cash, stock-based compensation expense. It also includes outside professional fees (e.g., legal,
information systems and accounting services) and other items associated with facilities and administration.
Following the Spin-off, the general and administrative expenses associated with the business and assets distributed to
EchoStar in connection with the Spin-off are no longer reflected in our “General and administrative expenses.”
Interest expense. “Interest expense” primarily includes interest expense, prepayment premiums and amortization of
debt issuance costs associated with our senior debt and convertible subordinated debt securities (net of capitalized
interest) and interest expense associated with our capital lease obligations.
“Other” income (expense), net. The main components of “Other” income and expense are unrealized gains and
losses from changes in fair value of non-marketable strategic investments accounted for at fair value, equity in
earnings and losses of our affiliates, gains and losses realized on the sale of investments, and impairment of
marketable and non-marketable investment securities.
Earnings before interest, taxes, depreciation and amortization (“EBITDA”). EBITDA is defined as “Net income
(loss)” plus “Interest expense” net of “Interest income,” “Taxes” and “Depreciation and amortization.” This “non-
GAAP measure” is reconciled to net income (loss) in our discussion of “Results of Operations” below.
DISH Network subscribers. We include customers obtained through direct sales, and through third-party retail
networks and other distribution relationships, in our DISH Network subscriber count. We also provide DISH
Network service to hotels, motels and other commercial accounts. For certain of these commercial accounts, we
divide our total revenue for these commercial accounts by an amount approximately equal to the retail price of our
America’s Top 100 programming package (but taking into account, periodically, price changes and other factors),
and include the resulting number, which is substantially smaller than the actual number of commercial units served,
in our DISH Network subscriber count. Previously, our end of period DISH Network subscriber count was rounded
down to the nearest five thousand. However, beginning December 31, 2008, we round to the nearest one thousand.
Average monthly revenue per subscriber (“ARPU”). We are not aware of any uniform standards for calculating
ARPU and believe presentations of ARPU may not be calculated consistently by other companies in the same or
similar businesses. We calculate average monthly revenue per subscriber, or ARPU, by dividing average monthly
“Subscriber-related revenue” for the period (total “Subscriber-related revenue” during the period divided by the
number of months in the period) by our average DISH Network subscribers for the period. Average DISH Network
subscribers are calculated for the period by adding the average DISH Network subscribers for each month and
dividing by the number of months in the period. Average DISH Network subscribers for each month are calculated
by adding the beginning and ending DISH Network subscribers for the month and dividing by two.
Subscriber churn rate. We are not aware of any uniform standards for calculating subscriber churn rate and
believe presentations of subscriber churn rates may not be calculated consistently by different companies in the
same or similar businesses. We calculate subscriber churn rate for any period by dividing the number of DISH
Network subscribers who terminated service during the period by the average monthly DISH Network subscribers
during the period, and further dividing by the number of months in the period. When calculating subscriber churn,
as is the case when calculating ARPU, the number of subscribers in a given month is based on the average of the
beginning-of-month and the end-of-month subscriber counts. Prior to the fourth quarter of 2008, the number of
subscribers at the beginning of each month was used as the number of subscribers for that month in our subscriber
churn calculation. The revised calculation produces a 1.86% churn rate for the year ended December 31, 2008
versus 1.85% using the prior calculation. Prior period subscriber churn figures have not been adjusted for this
revised subscriber churn calculation as the impacts were similarly immaterial.
Free cash flow. We define free cash flow as “Net cash flows from operating activities” less “Purchases of property
and equipment,” as shown on our Consolidated Statements of Cash Flows.