ComEd 2006 Annual Report Download - page 87
Download and view the complete annual report
Please find page 87 of the 2006 ComEd annual report below. You can navigate through the pages in the report by either clicking on the pages listed below, or by using the keyword search tool below to find specific information within the annual report.-
 1
1 -
2
-
3
-
4
-
5
-
6
-
7
-
8
-
9
-
10
-
11
-
12
-
13
-
14
-
15
-
16
-
17
-
18
-
19
-
20
-
21
-
22
-
23
-
24
-
25
-
26
-
27
-
28
-
29
-
30
-
31
-
32
-
33
-
34
-
35
-
36
-
37
-
38
-
39
-
40
-
41
-
42
-
43
-
44
-
45
-
46
-
47
-
48
-
49
-
50
-
51
-
52
-
53
-
54
-
55
-
56
-
57
-
58
-
59
-
60
-
61
-
62
-
63
-
64
-
65
-
66
-
67
-
68
-
69
-
70
-
71
-
72
-
73
-
74
-
75
-
76
-
 77
77 -
 78
78 -
 79
79 -
 80
80 -
 81
81 -
 82
82 -
 83
83 -
 84
84 -
 85
85 -
 86
86 -
 87
87 -
 88
88 -
 89
89 -
 90
90 -
 91
91 -
 92
92 -
 93
93 -
 94
94 -
 95
95 -
 96
96 -
 97
97 -
98
-
99
-
100
-
101
-
102
-
103
-
104
-
105
-
106
-
107
-
108
-
109
-
110
-
111
-
112
-
113
-
114
-
115
-
116
-
117
-
118
-
119
-
120
-
121
-
122
-
123
-
124
-
125
-
126
-
127
-
128
-
129
-
130
-
131
-
132
-
133
-
134
-
135
-
136
-
137
-
138
-
139
-
140
-
141
-
142
-
143
-
144
-
145
-
146
-
147
-
148
-
149
-
150
-
151
-
152
-
153
-
154
-
155
-
156
-
157
-
158
-
159
-
160
-
161
-
162
-
163
-
164
-
165
-
166
-
167
-
168
-
169
-
170
-
171
-
172
-
173
-
174
-
175
-
176
-
177
-
178
-
179
-
180
-
181
-
182
-
183
-
184
-
185
-
186
-
187
-
188
-
189
-
190
-
191
-
192
-
193
-
194
-
195
-
196
-
197
-
198
-
199
-
200
-
201
-
202
-
203
-
204
-
205
-
206
-
207
-
208
-
209
-
210
-
211
-
212
-
213
-
214
-
215
-
216
-
217
-
218
-
219
-
220
-
221
-
222
-
223
-
224
-
225
-
226
-
227
-
228
-
229
-
230
-
231
-
232
-
233
-
234
-
235
-
236
-
237
-
238
-
239
-
240
-
241
-
242
-
243
-
244
-
245
-
246
-
247
-
248
-
249
-
250
-
251
-
252
-
253
-
254
-
255
-
256
-
257
-
258
-
259
-
260
-
261
-
262
-
263
-
264
-
265
-
266
-
267
-
268
-
269
-
270
-
271
-
272
-
273
-
274
-
275
-
276
-
277
-
278
-
279
-
280
-
281
-
282
-
283
-
284
-
285
-
286
-
287
-
288
-
289
-
290
-
291
-
292
-
293
-
294
-
295
-
296
-
297
-
298
-
299
-
300
-
301
-
302
-
303
-
304
-
305
-
306
-
307
-
308
-
309
-
310
-
311
-
312
-
313
-
314
-
315
-
316
-
317
-
318
-
319
-
320
-
321
-
322
-
323
-
324
-
325
-
326
-
327
-
328
-
329
-
330
-
331
-
332
-
333
-
334
-
335
-
336
-
337
-
338
-
339
-
340
-
341
-
342
-
343
-
344
-
345
-
346
-
347
-
348
-
349
-
350
-
351
-
352
-
353
-
354
-
355
-
356
-
357
-
358
-
359
-
360
-
361
-
362
-
363
-
364
-
365
-
366
-
367
-
368
-
369
-
370
-
371
-
372
-
373
-
374
-
375
-
376
-
377
-
378
-
379
-
380
-
381
-
382
-
383
-
384
-
385
-
386
-
387
-
388
-
389
-
390
-
391
-
392
-
393
-
394
-
395
-
396
-
397
-
398
-
399
-
400
-
401
-
402
-
403
-
404
-
405
-
406
-
407
-
408
-
409
-
410
-
411
-
412
-
413
-
414
-
415
-
416
-
417
-
418
-
419
-
420
-
421
-
422
-
423
-
424
-
425
-
426
-
427
-
428
-
429
-
430
-
431
-
432
-
433
-
434
-
435
-
436
-
437
-
438
-
439
-
440
-
441
-
442
-
443
-
444
-
445
-
446
-
447
-
448
-
449
-
450
-
451
-
452
-
453
-
454
-
455
-
456
-
457
-
458
-
459
-
460
-
461
-
462
-
463
-
464
-
465
-
466
-
467
-
468
-
469
-
470
-
471
-
472
-
473
-
474
-
475
-
476
-
477
-
478
-
479
-
480
-
481
-
482
-
483
-
484
-
485
-
486
-
487
-
488
-
489
-
490
-
491
-
492
-
493
-
494
-
495
-
496
-
497
-
498
-
499
-
500
-
501
-
502
-
503
-
504
-
505
-
506
-
507
-
508
-
509
-
510
-
511
-
512
-
513
-
514
-
515
-
516
-
517
-
518
-
519
-
520
-
521
-
522
-
523
-
524
-
525
-
526
-
527
-
528
-
529
 |
 |

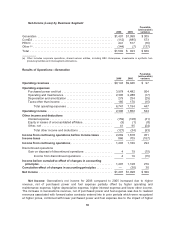
Wholesale and retail sales increased $299 million due to an increase in realized revenues
associated with forward sales entered into in prior periods, which were recognized at higher prices for
the year ended December 2006, as compared to the same period in 2005, offset by a reduction in
volumes sold into the market as a result of lower supply.
Retail gas sales. Retail gas sales decreased $73 million primarily due to lower volumes for 2006
compared to 2005, resulting in a $69 million decrease. Additionally, there was a decrease of $4 million
due to lower realized prices for 2006 compared to 2005.
Other revenues. The decrease in 2006 was primarily due to a decrease in fossil fuel sales.
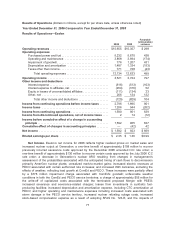
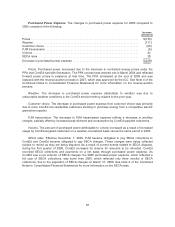
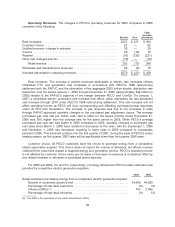
Purchased Power and Fuel Expense. Generation’s supply sources are summarized below:
Supply Source (in GWhs) 2006 2005 Variance % Change
Nuclear generation (a) ................................. 139,610 137,936 1,674 1.2%
Purchases—non-trading portfolio ....................... 38,297 42,623 (4,326) (10.1)%
Fossil and hydroelectric generation ...................... 12,773 13,778 (1,005) (7.3)%
Total supply ......................................... 190,680 194,337 (3,657) (1.9)%
(a) Represents Generation's proportionate share of the output of its nuclear generating plants, including Salem, which is
operated by PSEG Nuclear.
The changes in Generation’s purchased power and fuel expense for 2006 compared to 2005
consisted of the following:
(in millions) Price Volume
Increase
(Decrease)
Purchased power costs .......................................... $ (81) $(319) $(400)
Generation costs ................................................ 38 4 42
Fuel resale costs ................................................ 34 (65) (31)
Mark-to-market ................................................. n.m. n.m. (115)
Decrease in purchased power and fuel expense ...................... $(504)
n.m. Not meaningful
Purchased Power Costs. Purchased power costs include all costs associated with the
procurement of electricity including capacity, energy and fuel costs associated with tolling agreements.
Generation experienced a decrease of $319 million due to lower volumes of purchased power in the
market as a result of a lower demand from affiliates. Additionally, overall lower prices paid for
purchased power in 2006 compared to 2005 resulted in a $81 million decrease.
Generation Costs. Generation costs include fuel costs for internally generated energy. Generation
experienced overall higher generation costs in 2006 compared to 2005 due to increased prices related
to nuclear and fossil fuel generation, resulting in a $38 million increase.
Fuel Resale Costs. Fuel resale costs include retail gas purchases and wholesale fossil fuel
expenses. The changes in Generation’s fuel resale costs in 2006 compared to 2005 were a result of a
$65 million decrease in the retail gas business resulting from lower volumes, partially offset by overall
higher prices paid for gas.
Mark-to-market. Mark-to-market gains on power derivative activities were $180 million in 2006
compared to losses of $12 million in 2005. Mark-to-market losses on fuel derivative activities were $77
million in 2006 compared to zero in 2005.
82