ComEd 2006 Annual Report Download - page 107
Download and view the complete annual report
Please find page 107 of the 2006 ComEd annual report below. You can navigate through the pages in the report by either clicking on the pages listed below, or by using the keyword search tool below to find specific information within the annual report.-
 1
1 -
2
-
3
-
4
-
5
-
6
-
7
-
8
-
9
-
10
-
11
-
12
-
13
-
14
-
15
-
16
-
17
-
18
-
19
-
20
-
21
-
22
-
23
-
24
-
25
-
26
-
27
-
28
-
29
-
30
-
31
-
32
-
33
-
34
-
35
-
36
-
37
-
38
-
39
-
40
-
41
-
42
-
43
-
44
-
45
-
46
-
47
-
48
-
49
-
50
-
51
-
52
-
53
-
54
-
55
-
56
-
57
-
58
-
59
-
60
-
61
-
62
-
63
-
64
-
65
-
66
-
67
-
68
-
69
-
70
-
71
-
72
-
73
-
74
-
75
-
76
-
77
-
78
-
79
-
80
-
81
-
82
-
83
-
84
-
85
-
86
-
87
-
88
-
89
-
90
-
91
-
92
-
93
-
94
-
95
-
96
-
 97
97 -
 98
98 -
 99
99 -
 100
100 -
 101
101 -
 102
102 -
 103
103 -
 104
104 -
 105
105 -
 106
106 -
 107
107 -
 108
108 -
 109
109 -
 110
110 -
 111
111 -
 112
112 -
 113
113 -
 114
114 -
 115
115 -
 116
116 -
 117
117 -
118
-
119
-
120
-
121
-
122
-
123
-
124
-
125
-
126
-
127
-
128
-
129
-
130
-
131
-
132
-
133
-
134
-
135
-
136
-
137
-
138
-
139
-
140
-
141
-
142
-
143
-
144
-
145
-
146
-
147
-
148
-
149
-
150
-
151
-
152
-
153
-
154
-
155
-
156
-
157
-
158
-
159
-
160
-
161
-
162
-
163
-
164
-
165
-
166
-
167
-
168
-
169
-
170
-
171
-
172
-
173
-
174
-
175
-
176
-
177
-
178
-
179
-
180
-
181
-
182
-
183
-
184
-
185
-
186
-
187
-
188
-
189
-
190
-
191
-
192
-
193
-
194
-
195
-
196
-
197
-
198
-
199
-
200
-
201
-
202
-
203
-
204
-
205
-
206
-
207
-
208
-
209
-
210
-
211
-
212
-
213
-
214
-
215
-
216
-
217
-
218
-
219
-
220
-
221
-
222
-
223
-
224
-
225
-
226
-
227
-
228
-
229
-
230
-
231
-
232
-
233
-
234
-
235
-
236
-
237
-
238
-
239
-
240
-
241
-
242
-
243
-
244
-
245
-
246
-
247
-
248
-
249
-
250
-
251
-
252
-
253
-
254
-
255
-
256
-
257
-
258
-
259
-
260
-
261
-
262
-
263
-
264
-
265
-
266
-
267
-
268
-
269
-
270
-
271
-
272
-
273
-
274
-
275
-
276
-
277
-
278
-
279
-
280
-
281
-
282
-
283
-
284
-
285
-
286
-
287
-
288
-
289
-
290
-
291
-
292
-
293
-
294
-
295
-
296
-
297
-
298
-
299
-
300
-
301
-
302
-
303
-
304
-
305
-
306
-
307
-
308
-
309
-
310
-
311
-
312
-
313
-
314
-
315
-
316
-
317
-
318
-
319
-
320
-
321
-
322
-
323
-
324
-
325
-
326
-
327
-
328
-
329
-
330
-
331
-
332
-
333
-
334
-
335
-
336
-
337
-
338
-
339
-
340
-
341
-
342
-
343
-
344
-
345
-
346
-
347
-
348
-
349
-
350
-
351
-
352
-
353
-
354
-
355
-
356
-
357
-
358
-
359
-
360
-
361
-
362
-
363
-
364
-
365
-
366
-
367
-
368
-
369
-
370
-
371
-
372
-
373
-
374
-
375
-
376
-
377
-
378
-
379
-
380
-
381
-
382
-
383
-
384
-
385
-
386
-
387
-
388
-
389
-
390
-
391
-
392
-
393
-
394
-
395
-
396
-
397
-
398
-
399
-
400
-
401
-
402
-
403
-
404
-
405
-
406
-
407
-
408
-
409
-
410
-
411
-
412
-
413
-
414
-
415
-
416
-
417
-
418
-
419
-
420
-
421
-
422
-
423
-
424
-
425
-
426
-
427
-
428
-
429
-
430
-
431
-
432
-
433
-
434
-
435
-
436
-
437
-
438
-
439
-
440
-
441
-
442
-
443
-
444
-
445
-
446
-
447
-
448
-
449
-
450
-
451
-
452
-
453
-
454
-
455
-
456
-
457
-
458
-
459
-
460
-
461
-
462
-
463
-
464
-
465
-
466
-
467
-
468
-
469
-
470
-
471
-
472
-
473
-
474
-
475
-
476
-
477
-
478
-
479
-
480
-
481
-
482
-
483
-
484
-
485
-
486
-
487
-
488
-
489
-
490
-
491
-
492
-
493
-
494
-
495
-
496
-
497
-
498
-
499
-
500
-
501
-
502
-
503
-
504
-
505
-
506
-
507
-
508
-
509
-
510
-
511
-
512
-
513
-
514
-
515
-
516
-
517
-
518
-
519
-
520
-
521
-
522
-
523
-
524
-
525
-
526
-
527
-
528
-
529
 |
 |

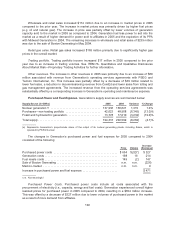
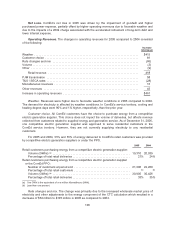
Wholesale and retail sales increased $114 million due to an increase in market prices in 2005
compared to the prior year. The increase in market prices was primarily driven by higher fuel prices
(e.g. oil and natural gas). The increase in price was partially offset by lower volumes of generation
capacity sold to the market in 2005 as compared to 2004. Generation had less power to sell into the
market as a result of higher demand for power sold to affiliates in 2005 and the expiration of its PPA
with Midwest Generation in 2004. The remaining decrease in wholesale and retail sales of $239 million
was due to the sale of Boston Generating in May 2004.
Retail gas sales. Retail gas sales increased $165 million primarily due to significantly higher gas
prices in the overall market.
Trading portfolio. Trading portfolio income increased $17 million in 2005 compared to the prior
year due to an increase in trading volumes. See ITEM 7A. Quantitative and Qualitative Disclosures
About Market Risk—Proprietary Trading Activities for further information.
Other revenues. The increase in other revenues in 2005 was primarily due to an increase of $60
million associated with revenue from Generation’s operating services agreements with PSEG and
Tamuin International, Inc. This increase was partially offset by a decrease of $39 million related to
lower fuel sales, a reduction in decommissioning revenue from ComEd and lower sales from tolling and
gas management agreements. The increased revenue from the operating services agreements was
substantially offset by a corresponding increase in Generation’s operating and maintenance expense.
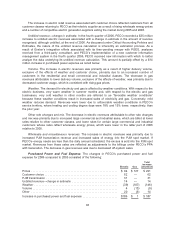
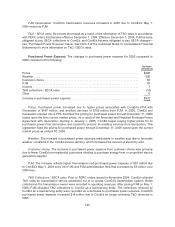
Purchased Power and Fuel Expense. Generation’s supply sources are summarized below:
Supply Source (in GWhs) 2005 2004 Variance % Change
Nuclear generation (a) ................................. 137,936 136,621 1,315 1.0%
Purchases—non-trading portfolio ....................... 42,623 48,968 (6,345) (13.0)%
Fossil and hydroelectric generation ...................... 13,778 17,010 (3,232) (19.0)%
Total supply ......................................... 194,337 202,599 (8,262) (4.1)%
(a) Represents Generation’s proportionate share of the output of its nuclear generating plants, including Salem, which is
operated by PSEG Nuclear.
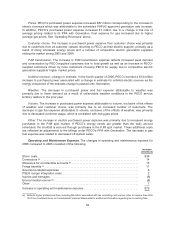
The changes in Generation’s purchased power and fuel expense for 2005 compared to 2004
consisted of the following:
Price Volume
Increase
(Decrease)
Purchased power costs .......................................... $654 $(327) $ 327
Generation costs ................................................ 198 16 214
Fuel resale costs ................................................ 149 (2) 147
Sale of Boston Generating ........................................ n.m. n.m. (226)
Mark-to-market ................................................. n.m. n.m. 9
Increase in purchased power and fuel expense ....................... $471
n.m. Not meaningful
Purchased Power Costs. Purchased power costs include all costs associated with the
procurement of electricity (i.e., capacity, energy and fuel costs). Generation experienced overall higher
realized prices for purchased power in 2005 compared to 2004, resulting in a $654 million increase.
This was offset by a decrease of $327 million due to lower volumes of purchased power in the market
as a result of more demand from affiliates.
102