ComEd 2006 Annual Report Download - page 274
Download and view the complete annual report
Please find page 274 of the 2006 ComEd annual report below. You can navigate through the pages in the report by either clicking on the pages listed below, or by using the keyword search tool below to find specific information within the annual report.-
 1
1 -
2
-
3
-
4
-
5
-
6
-
7
-
8
-
9
-
10
-
11
-
12
-
13
-
14
-
15
-
16
-
17
-
18
-
19
-
20
-
21
-
22
-
23
-
24
-
25
-
26
-
27
-
28
-
29
-
30
-
31
-
32
-
33
-
34
-
35
-
36
-
37
-
38
-
39
-
40
-
41
-
42
-
43
-
44
-
45
-
46
-
47
-
48
-
49
-
50
-
51
-
52
-
53
-
54
-
55
-
56
-
57
-
58
-
59
-
60
-
61
-
62
-
63
-
64
-
65
-
66
-
67
-
68
-
69
-
70
-
71
-
72
-
73
-
74
-
75
-
76
-
77
-
78
-
79
-
80
-
81
-
82
-
83
-
84
-
85
-
86
-
87
-
88
-
89
-
90
-
91
-
92
-
93
-
94
-
95
-
96
-
97
-
98
-
99
-
100
-
101
-
102
-
103
-
104
-
105
-
106
-
107
-
108
-
109
-
110
-
111
-
112
-
113
-
114
-
115
-
116
-
117
-
118
-
119
-
120
-
121
-
122
-
123
-
124
-
125
-
126
-
127
-
128
-
129
-
130
-
131
-
132
-
133
-
134
-
135
-
136
-
137
-
138
-
139
-
140
-
141
-
142
-
143
-
144
-
145
-
146
-
147
-
148
-
149
-
150
-
151
-
152
-
153
-
154
-
155
-
156
-
157
-
158
-
159
-
160
-
161
-
162
-
163
-
164
-
165
-
166
-
167
-
168
-
169
-
170
-
171
-
172
-
173
-
174
-
175
-
176
-
177
-
178
-
179
-
180
-
181
-
182
-
183
-
184
-
185
-
186
-
187
-
188
-
189
-
190
-
191
-
192
-
193
-
194
-
195
-
196
-
197
-
198
-
199
-
200
-
201
-
202
-
203
-
204
-
205
-
206
-
207
-
208
-
209
-
210
-
211
-
212
-
213
-
214
-
215
-
216
-
217
-
218
-
219
-
220
-
221
-
222
-
223
-
224
-
225
-
226
-
227
-
228
-
229
-
230
-
231
-
232
-
233
-
234
-
235
-
236
-
237
-
238
-
239
-
240
-
241
-
242
-
243
-
244
-
245
-
246
-
247
-
248
-
249
-
250
-
251
-
252
-
253
-
254
-
255
-
256
-
257
-
258
-
259
-
260
-
261
-
262
-
263
-
 264
264 -
 265
265 -
 266
266 -
 267
267 -
 268
268 -
 269
269 -
 270
270 -
 271
271 -
 272
272 -
 273
273 -
 274
274 -
 275
275 -
 276
276 -
 277
277 -
 278
278 -
 279
279 -
 280
280 -
 281
281 -
 282
282 -
 283
283 -
 284
284 -
285
-
286
-
287
-
288
-
289
-
290
-
291
-
292
-
293
-
294
-
295
-
296
-
297
-
298
-
299
-
300
-
301
-
302
-
303
-
304
-
305
-
306
-
307
-
308
-
309
-
310
-
311
-
312
-
313
-
314
-
315
-
316
-
317
-
318
-
319
-
320
-
321
-
322
-
323
-
324
-
325
-
326
-
327
-
328
-
329
-
330
-
331
-
332
-
333
-
334
-
335
-
336
-
337
-
338
-
339
-
340
-
341
-
342
-
343
-
344
-
345
-
346
-
347
-
348
-
349
-
350
-
351
-
352
-
353
-
354
-
355
-
356
-
357
-
358
-
359
-
360
-
361
-
362
-
363
-
364
-
365
-
366
-
367
-
368
-
369
-
370
-
371
-
372
-
373
-
374
-
375
-
376
-
377
-
378
-
379
-
380
-
381
-
382
-
383
-
384
-
385
-
386
-
387
-
388
-
389
-
390
-
391
-
392
-
393
-
394
-
395
-
396
-
397
-
398
-
399
-
400
-
401
-
402
-
403
-
404
-
405
-
406
-
407
-
408
-
409
-
410
-
411
-
412
-
413
-
414
-
415
-
416
-
417
-
418
-
419
-
420
-
421
-
422
-
423
-
424
-
425
-
426
-
427
-
428
-
429
-
430
-
431
-
432
-
433
-
434
-
435
-
436
-
437
-
438
-
439
-
440
-
441
-
442
-
443
-
444
-
445
-
446
-
447
-
448
-
449
-
450
-
451
-
452
-
453
-
454
-
455
-
456
-
457
-
458
-
459
-
460
-
461
-
462
-
463
-
464
-
465
-
466
-
467
-
468
-
469
-
470
-
471
-
472
-
473
-
474
-
475
-
476
-
477
-
478
-
479
-
480
-
481
-
482
-
483
-
484
-
485
-
486
-
487
-
488
-
489
-
490
-
491
-
492
-
493
-
494
-
495
-
496
-
497
-
498
-
499
-
500
-
501
-
502
-
503
-
504
-
505
-
506
-
507
-
508
-
509
-
510
-
511
-
512
-
513
-
514
-
515
-
516
-
517
-
518
-
519
-
520
-
521
-
522
-
523
-
524
-
525
-
526
-
527
-
528
-
529
 |
 |

Exelon Corporation and Subsidiary Companies
Exelon Generation Company, LLC and Subsidiary Companies
Commonwealth Edison Company and Subsidiary Companies
PECO Energy Company and Subsidiary Companies
Combined Notes to Consolidated Financial Statements—(Continued)
(Dollars in millions, except per share data unless otherwise noted)
AmerGen’s pension plans. In 2006, the additional minimum pension liability was reduced by $1.7 billion
and shareholders’ equity increased by $1.1 billion primarily as a result of an annual actuarial valuation
associated with Exelon’s and AmerGen’s pension plans prior to the recording of SFAS No. 158.
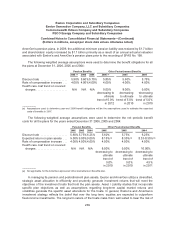
The following weighted average assumptions were used to determine the benefit obligations for all
the plans at December 31, 2006, 2005 and 2004:
Pension Benefits Other Postretirement Benefits
2006 (a) 2005 2004 2006 (a) 2005 2004
Discount rate .................. 5.90% 5.60%5.75% 5.85% 5.60% 5.75%
Rate of compensation increase . . . 4.00% 4.00% 4.00% 4.00% 4.00% 4.00%
Health care cost trend on covered
charges ..................... N/A N/A N/A 9.00% 8.00% 9.00%
decreasing to
ultimate
trend of 5.0%
in 2012
decreasing
to ultimate
trend of 5.0%
in 2010
decreasing
to ultimate
trend of 5.0%
in 2010
(a) Assumptions used to determine year-end 2006 benefit obligations will be the assumptions used to estimate the expected
costs of benefits in 2007.
The following weighted average assumptions were used to determine the net periodic benefit
costs for all the plans for the years ended December 31 2006, 2005 and 2004:
Pension Benefits Other Postretirement Benefits
2006 2005 2004 2006 2005 2004
Discount rate .................. 5.60%5.75% 6.25% 5.60% 5.75% 6.25%
Expected return on plan assets . . . 9.00%9.00% 9.00% 8.15%(a) 8.30%(a) 8.33-8.35%(a)
Rate of compensation increase . . . 4.00%4.00% 4.00% 4.00% 4.00% 4.00%
Health care cost trend on covered
charges ..................... N/A N/A N/A 8.00% 9.00% 10.00%
decreasing to
ultimate
trend of
5.0%
in 2010
decreasing to
ultimate
trend of
5.0%
in 2010
decreasing to
ultimate
trend of
4.5%
in 2011
(a) Not applicable for the AmerGen-sponsored other postretirement benefits plan.
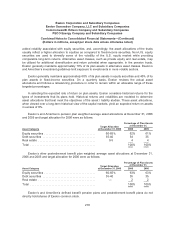
In managing its pension and postretirement plan assets, Exelon and AmerGen utilize a diversified,
strategic asset allocation to efficiently and prudently generate investment returns that will meet the
objectives of the investment trusts that hold the plan assets. Asset / Liability studies that incorporate
specific plan objectives as well as assumptions regarding long-term capital market returns and
volatilities generate the specific asset allocations for the trusts. In general, Exelon’s and AmerGen’s
investment strategy reflects the belief that over the long term, equities are expected to outperform
fixed-income investments. The long-term nature of the trusts make them well suited to bear the risk of
269