Avis 2006 Annual Report Download - page 97
Download and view the complete annual report
Please find page 97 of the 2006 Avis annual report below. You can navigate through the pages in the report by either clicking on the pages listed below, or by using the keyword search tool below to find specific information within the annual report.-
 1
1 -
2
-
3
-
4
-
5
-
6
-
7
-
8
-
9
-
10
-
11
-
12
-
13
-
14
-
15
-
16
-
17
-
18
-
19
-
20
-
21
-
22
-
23
-
24
-
25
-
26
-
27
-
28
-
29
-
30
-
31
-
32
-
33
-
34
-
35
-
36
-
37
-
38
-
39
-
40
-
41
-
42
-
43
-
44
-
45
-
46
-
47
-
48
-
49
-
50
-
51
-
52
-
53
-
54
-
55
-
56
-
57
-
58
-
59
-
60
-
61
-
62
-
63
-
64
-
65
-
66
-
67
-
68
-
69
-
70
-
71
-
72
-
73
-
74
-
75
-
76
-
77
-
78
-
79
-
80
-
81
-
82
-
83
-
84
-
85
-
86
-
 87
87 -
 88
88 -
 89
89 -
 90
90 -
 91
91 -
 92
92 -
 93
93 -
 94
94 -
 95
95 -
 96
96 -
 97
97 -
 98
98 -
 99
99 -
 100
100 -
 101
101 -
 102
102 -
 103
103 -
 104
104 -
 105
105 -
 106
106 -
 107
107 -
108
-
109
-
110
-
111
-
112
-
113
-
114
-
115
-
116
-
117
-
118
-
119
-
120
-
121
-
122
-
123
-
124
-
125
-
126
-
127
-
128
-
129
-
130
-
131
-
132
-
133
-
134
-
135
-
136
-
137
-
138
-
139
-
140
-
141
-
142
-
143
-
144
-
145
-
146
-
147
-
148
-
149
-
150
-
151
-
152
-
153
-
154
-
155
-
156
-
157
-
158
-
159
-
160
-
161
-
162
-
163
-
164
-
165
-
166
-
167
-
168
-
169
-
170
-
171
-
172
-
173
-
174
-
175
-
176
-
177
-
178
-
179
-
180
-
181
-
182
-
183
-
184
-
185
-
186
-
187
-
188
-
189
-
190
-
191
-
192
-
193
-
194
-
195
-
196
-
197
-
198
-
199
-
200
-
201
-
202
-
203
-
204
-
205
-
206
-
207
-
208
-
209
-
210
-
211
-
212
-
213
-
214
-
215
-
216
-
217
-
218
-
219
-
220
-
221
-
222
-
223
-
224
-
225
-
226
-
227
-
228
-
229
-
230
-
231
-
232
-
233
-
234
-
235
-
236
-
237
-
238
-
239
-
240
-
241
-
242
-
243
-
244
-
245
-
246
-
247
-
248
-
249
-
250
-
251
-
252
-
253
-
254
-
255
-
256
-
257
-
258
-
259
-
260
-
261
-
262
-
263
-
264
-
265
-
266
-
267
-
268
-
269
-
270
-
271
-
272
-
273
-
274
-
275
-
276
-
277
-
278
-
279
-
280
-
281
-
282
-
283
-
284
-
285
-
286
-
287
-
288
-
289
-
290
-
291
-
292
-
293
-
294
-
295
-
296
-
297
-
298
-
299
-
300
-
301
-
302
-
303
-
304
-
305
-
306
-
307
-
308
-
309
-
310
-
311
-
312
-
313
-
314
-
315
-
316
-
317
 |
 |

Table of Contents
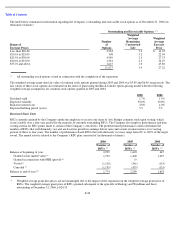
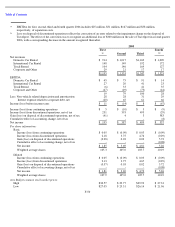
The table below summarizes information regarding the Company’s outstanding and exercisable stock options as of December 31, 2006 (in
thousands of shares):
Outstanding and Exercisable Options
(*)
Range of
Exercise Prices
Number
of
Options
Weighted
Average
Remaining
Contractual
Life
Weighted
Average
Exercise
Price
Less than $20.00
2,984
5.2
$
14.92
$20.01 to $25.00
308
5.2
22.04
$25.01 to $30.00
4,549
2.5
27.33
$30.01 to $35.00
1,581
2.3
32.19
$35.01 and above
1,615
1.0
45.80
11,037
3.4
27.22
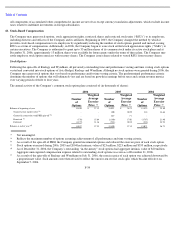
The weighted-average grant-
date fair value of common stock options granted during 2005 and 2004 was $5.89 and $6.90, respectively. The
fair values of these stock options are estimated on the dates of grant using the Black-Scholes option-pricing model with the following
weighted average assumptions for common stock options granted in 2005 and 2004:
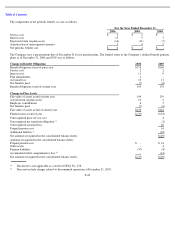
Restricted Stock Units
RSUs currently granted by the Company entitle the employee to receive one share of Avis Budget common stock upon vesting, which
occurs ratably over a four-year period for the majority of currently outstanding RSUs. The Company also employs performance and time
vesting criteria for RSU grants made to certain of the Company’s executives. The predetermined performance criteria determine the
number of RSUs that will ultimately vest and are based on growth in earnings before taxes and certain revenue metrics over varying
periods of three to four years. The number of performance-based RSUs that will ultimately vest may range from 0% to 100% of the target
award. The annual activity related to the Company’s RSU plan consisted of (in thousands of shares):
(*)
All outstanding stock options vested in connection with the completion of the separation.
2005
2004
Dividend yield
1.7
%
1.5
%
Expected volatility
30.0
%
30.0
%
Risk
-
free interest rate
3.8
%
4.0
%
Expected holding period (years)
5.5
5.5
2006
2005
2004
Number of
RSUs
(*)
Number of
RSUs
(*)
Number of
RSUs
(*)
Balance at beginning of year
2,299
1,618
647
Granted at fair market value
(a)
1,799
1,402
1,255
Granted in connection with PHH spin-off
(b)
-
77
-
Vested
(c)
(1,129
)
(341
)
(153
)
Canceled
(c)
(1,195
)
(457
)
(131
)
Balance at end of year
(d)
1,774
2,299
1,618
F
-
40
(*)
Weighted average grant date prices are not meaningful due to the impact of the separation on the weighted average grant price of
RSUs. The weighted average grant price of RSUs granted subsequent to the spin-offs of Realogy and Wyndham and those
outstanding at December 31, 2006 is $24.33.