Avis 2006 Annual Report Download - page 43
Download and view the complete annual report
Please find page 43 of the 2006 Avis annual report below. You can navigate through the pages in the report by either clicking on the pages listed below, or by using the keyword search tool below to find specific information within the annual report.-
 1
1 -
2
-
3
-
4
-
5
-
6
-
7
-
8
-
9
-
10
-
11
-
12
-
13
-
14
-
15
-
16
-
17
-
18
-
19
-
20
-
21
-
22
-
23
-
24
-
25
-
26
-
27
-
28
-
29
-
30
-
31
-
32
-
 33
33 -
 34
34 -
 35
35 -
 36
36 -
 37
37 -
 38
38 -
 39
39 -
 40
40 -
 41
41 -
 42
42 -
 43
43 -
 44
44 -
 45
45 -
 46
46 -
 47
47 -
 48
48 -
 49
49 -
 50
50 -
 51
51 -
 52
52 -
 53
53 -
54
-
55
-
56
-
57
-
58
-
59
-
60
-
61
-
62
-
63
-
64
-
65
-
66
-
67
-
68
-
69
-
70
-
71
-
72
-
73
-
74
-
75
-
76
-
77
-
78
-
79
-
80
-
81
-
82
-
83
-
84
-
85
-
86
-
87
-
88
-
89
-
90
-
91
-
92
-
93
-
94
-
95
-
96
-
97
-
98
-
99
-
100
-
101
-
102
-
103
-
104
-
105
-
106
-
107
-
108
-
109
-
110
-
111
-
112
-
113
-
114
-
115
-
116
-
117
-
118
-
119
-
120
-
121
-
122
-
123
-
124
-
125
-
126
-
127
-
128
-
129
-
130
-
131
-
132
-
133
-
134
-
135
-
136
-
137
-
138
-
139
-
140
-
141
-
142
-
143
-
144
-
145
-
146
-
147
-
148
-
149
-
150
-
151
-
152
-
153
-
154
-
155
-
156
-
157
-
158
-
159
-
160
-
161
-
162
-
163
-
164
-
165
-
166
-
167
-
168
-
169
-
170
-
171
-
172
-
173
-
174
-
175
-
176
-
177
-
178
-
179
-
180
-
181
-
182
-
183
-
184
-
185
-
186
-
187
-
188
-
189
-
190
-
191
-
192
-
193
-
194
-
195
-
196
-
197
-
198
-
199
-
200
-
201
-
202
-
203
-
204
-
205
-
206
-
207
-
208
-
209
-
210
-
211
-
212
-
213
-
214
-
215
-
216
-
217
-
218
-
219
-
220
-
221
-
222
-
223
-
224
-
225
-
226
-
227
-
228
-
229
-
230
-
231
-
232
-
233
-
234
-
235
-
236
-
237
-
238
-
239
-
240
-
241
-
242
-
243
-
244
-
245
-
246
-
247
-
248
-
249
-
250
-
251
-
252
-
253
-
254
-
255
-
256
-
257
-
258
-
259
-
260
-
261
-
262
-
263
-
264
-
265
-
266
-
267
-
268
-
269
-
270
-
271
-
272
-
273
-
274
-
275
-
276
-
277
-
278
-
279
-
280
-
281
-
282
-
283
-
284
-
285
-
286
-
287
-
288
-
289
-
290
-
291
-
292
-
293
-
294
-
295
-
296
-
297
-
298
-
299
-
300
-
301
-
302
-
303
-
304
-
305
-
306
-
307
-
308
-
309
-
310
-
311
-
312
-
313
-
314
-
315
-
316
-
317
 |
 |

Table of Contents
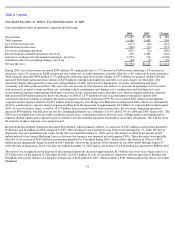
resulting from an increase of 15% in the average size of our domestic and international car rental fleets and, in the case of vehicle depreciation,
reductions to manufacturer incentives received on our domestic car rental fleet. As a result of these items, as well as a $13 million decrease in
our benefit from income taxes, our income from continuing operations decreased $82 million. The benefit from income taxes for 2005 and
2004 reflects the favorable resolution of prior years’ examination matters.
Income from discontinued operations decreased $734 million, which primarily reflects (i) a decrease of $291 million in net income generated
by Travelport which reflects a $425 million impairment charge recorded during 2005 partially offset by increased revenue, (ii) a decrease of
$259 million in net income generated by our Marketing Services division, which principally reflects the reversal of a tax valuation allowance of
$121 million in January 2004, and (iii) a decrease of $131 million in net income generated by PHH (this business was included in our 2005
results through January 31, 2005, the date of disposition, but was included in our results for all of 2004).
The net gain we recognized on the disposal of discontinued operations increased $351 million year-over-year, which includes a $581 million
gain recognized in connection with the sale of our former Marketing Services division during 2005 and a $253 million gain recognized during
2005 in connection with the initial public offering of Wright Express, partially offset by (i) a $281 million non-cash impairment charge and $4
million of transaction costs relating to the PHH spin-off and (ii) the absence of a $198 million gain recognized in connection with the June
2004 sale of Jackson Hewitt. In 2005, we also recorded a $14 million ($8 million, after tax) non-cash charge to reflect the cumulative effect of
accounting change as a result of our adoption of FASB Interpretation No. 47, “Accounting for Conditional Asset Retirement Obligations” in
fourth quarter 2005.
As a result of the above-mentioned items, net income decreased $473 million.
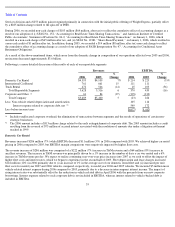
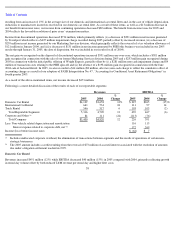
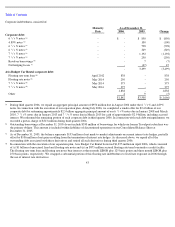
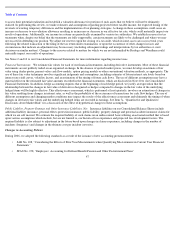
Following is a more detailed discussion of the results of each of our reportable segments:
Revenues
EBITDA
2005
2004
%
Change
2005
2004
%
Change
Domestic Car Rental
$
4,109
$
3,658
12
%
$
225
$
265
(15
)%
International Car Rental
661
534
24
111
97
14
Truck Rental
546
517
6
103
105
(2
)
Total Reportable Segments
5,316
4,709
13
439
467
(6
)
Corporate and Other
(a)
84
111
(24
)
(213
)
(76
)
Total Company
$
5,400
$
4,820
12
226
391
Less: Non
-
vehicle related depreciation and amortization
116
115
Interest expense related to corporate debt, net
(b)
172
269
Income (loss) before income taxes
$
(62
)
$
7
(a)
Includes unallocated corporate overhead, the elimination of transactions between segments and the results of operations of certain non-
strategic businesses.
Domestic Car Rental
Revenues increased $451 million (12%) while EBITDA decreased $40 million (15%) in 2005 compared with 2004, primarily reflecting growth
in rental day volume offset by both reduced T&M revenue per rental day and higher fleet costs.
38
(b)
The 2005 amount includes a credit resulting from the reversal of $73 million of accrued interest associated with the resolution of amounts
due under a litigation settlement reached in 1999.