Avis 2006 Annual Report Download - page 42
Download and view the complete annual report
Please find page 42 of the 2006 Avis annual report below. You can navigate through the pages in the report by either clicking on the pages listed below, or by using the keyword search tool below to find specific information within the annual report.-
 1
1 -
2
-
3
-
4
-
5
-
6
-
7
-
8
-
9
-
10
-
11
-
12
-
13
-
14
-
15
-
16
-
17
-
18
-
19
-
20
-
21
-
22
-
23
-
24
-
25
-
26
-
27
-
28
-
29
-
30
-
31
-
 32
32 -
 33
33 -
 34
34 -
 35
35 -
 36
36 -
 37
37 -
 38
38 -
 39
39 -
 40
40 -
 41
41 -
 42
42 -
 43
43 -
 44
44 -
 45
45 -
 46
46 -
 47
47 -
 48
48 -
 49
49 -
 50
50 -
 51
51 -
 52
52 -
53
-
54
-
55
-
56
-
57
-
58
-
59
-
60
-
61
-
62
-
63
-
64
-
65
-
66
-
67
-
68
-
69
-
70
-
71
-
72
-
73
-
74
-
75
-
76
-
77
-
78
-
79
-
80
-
81
-
82
-
83
-
84
-
85
-
86
-
87
-
88
-
89
-
90
-
91
-
92
-
93
-
94
-
95
-
96
-
97
-
98
-
99
-
100
-
101
-
102
-
103
-
104
-
105
-
106
-
107
-
108
-
109
-
110
-
111
-
112
-
113
-
114
-
115
-
116
-
117
-
118
-
119
-
120
-
121
-
122
-
123
-
124
-
125
-
126
-
127
-
128
-
129
-
130
-
131
-
132
-
133
-
134
-
135
-
136
-
137
-
138
-
139
-
140
-
141
-
142
-
143
-
144
-
145
-
146
-
147
-
148
-
149
-
150
-
151
-
152
-
153
-
154
-
155
-
156
-
157
-
158
-
159
-
160
-
161
-
162
-
163
-
164
-
165
-
166
-
167
-
168
-
169
-
170
-
171
-
172
-
173
-
174
-
175
-
176
-
177
-
178
-
179
-
180
-
181
-
182
-
183
-
184
-
185
-
186
-
187
-
188
-
189
-
190
-
191
-
192
-
193
-
194
-
195
-
196
-
197
-
198
-
199
-
200
-
201
-
202
-
203
-
204
-
205
-
206
-
207
-
208
-
209
-
210
-
211
-
212
-
213
-
214
-
215
-
216
-
217
-
218
-
219
-
220
-
221
-
222
-
223
-
224
-
225
-
226
-
227
-
228
-
229
-
230
-
231
-
232
-
233
-
234
-
235
-
236
-
237
-
238
-
239
-
240
-
241
-
242
-
243
-
244
-
245
-
246
-
247
-
248
-
249
-
250
-
251
-
252
-
253
-
254
-
255
-
256
-
257
-
258
-
259
-
260
-
261
-
262
-
263
-
264
-
265
-
266
-
267
-
268
-
269
-
270
-
271
-
272
-
273
-
274
-
275
-
276
-
277
-
278
-
279
-
280
-
281
-
282
-
283
-
284
-
285
-
286
-
287
-
288
-
289
-
290
-
291
-
292
-
293
-
294
-
295
-
296
-
297
-
298
-
299
-
300
-
301
-
302
-
303
-
304
-
305
-
306
-
307
-
308
-
309
-
310
-
311
-
312
-
313
-
314
-
315
-
316
-
317
 |
 |

Table of Contents
reflected declines primarily in commercial volumes and a 5% reduction in the average size of our rental fleet. Despite the reduction in the
average size of our truck rental fleet, reflecting our efforts to focus on newer and more efficient trucks, we incurred $23 million (23%) of
incremental fleet depreciation, interest and lease charges primarily due to higher per-unit fleet costs. EBITDA was also unfavorably impacted
by the absence of a $13 million credit relating to a refinement made during 2005 in how we estimate repair and refurbishment costs of our truck
fleet. During 2006, we recorded $3 million of separation-
related charges, including debt termination and other costs. These items were partially
offset by (i) a $31 million decrease in operating expenses primarily due to operating a smaller and more efficient fleet and reduced rental
volumes, (ii) a $13 million decrease in our public liability and property damage costs as a result of more favorable claims experience and a
reduction in rental days, (iii) a decrease of $12 million in credit card and other commission expense partially associated with decreased T&M
revenue and (iv) the absence of a $5 million restructuring charge recorded in 2005, which represented costs incurred in connection with the
closure of a reservation center and unprofitable rental locations, which was more than offset by an $8 million charge in 2006 principally related
to the closure of the Budget Truck Rental headquarters and other facilities and reductions in staff.
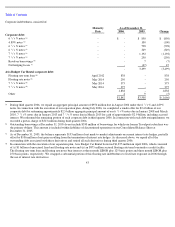
Corporate and Other
Revenues decreased $23 million and the EBITDA loss increased from $213 million in 2005 to $393 million in 2006.
Revenues and EBITDA were unfavorably impacted in 2006 by the absence of an $18 million realized gain on the sale of Homestore stock in
2005. Revenues were also impacted by a $12 million reduction in earnings on a credit card marketing program under which we earned fees
based on a percentage of credit card spending through the date of the separation.
EBITDA was also unfavorably impacted year-over-year by a $182 million increase in general and administrative costs in 2006, including
separation-related charges, unallocated corporate expenses and executive salaries. These increases were partially offset by a $32 million
decrease in incentive compensation costs in 2006, and the absence in 2006 of $19 million of restructuring charges recorded during 2005.
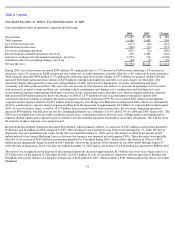
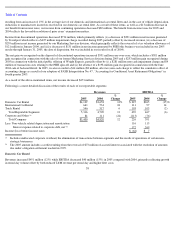
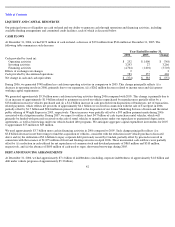
Year Ended December 31, 2005 vs. Year Ended December 31, 2004
Our consolidated results of operations comprised the following:
During 2005, our total revenues increased $580 million (12%) principally due to an 11% increase in T&M revenue reflecting a 14% increase in
domestic rental days and a 17% increase in international rental days. Total expenses increased $649 million (13%) principally reflecting
(i) $306 million of additional vehicle related operating expenses primarily associated with increased car rental volume and fleet size, including
vehicle maintenance and damage costs, commissions and shuttling costs and (ii) $250 million of additional vehicle depreciation and lease
charges, as well as $65 million of additional vehicle interest expense, both primarily
37
2005
2004
Change
Net revenues
$
5,400
$
4,820
$
580
Total expenses
5,462
4,813
649
Income (loss) before income taxes
(62
)
7
(69
)
Benefit from income taxes
(51
)
(64
)
13
Income (loss) from continuing operations
(11
)
71
(82
)
Income from discontinued operations, net of tax
1,088
1,822
(734
)
Gain on disposal of discontinued operations, net of tax
549
198
351
Cumulative effect of accounting change, net of tax
(8
)
-
(8
)
Net income
$
1,618
$
2,091
$
(473
)