Avis 2006 Annual Report Download - page 41
Download and view the complete annual report
Please find page 41 of the 2006 Avis annual report below. You can navigate through the pages in the report by either clicking on the pages listed below, or by using the keyword search tool below to find specific information within the annual report.-
 1
1 -
2
-
3
-
4
-
5
-
6
-
7
-
8
-
9
-
10
-
11
-
12
-
13
-
14
-
15
-
16
-
17
-
18
-
19
-
20
-
21
-
22
-
23
-
24
-
25
-
26
-
27
-
28
-
29
-
30
-
 31
31 -
 32
32 -
 33
33 -
 34
34 -
 35
35 -
 36
36 -
 37
37 -
 38
38 -
 39
39 -
 40
40 -
 41
41 -
 42
42 -
 43
43 -
 44
44 -
 45
45 -
 46
46 -
 47
47 -
 48
48 -
 49
49 -
 50
50 -
 51
51 -
52
-
53
-
54
-
55
-
56
-
57
-
58
-
59
-
60
-
61
-
62
-
63
-
64
-
65
-
66
-
67
-
68
-
69
-
70
-
71
-
72
-
73
-
74
-
75
-
76
-
77
-
78
-
79
-
80
-
81
-
82
-
83
-
84
-
85
-
86
-
87
-
88
-
89
-
90
-
91
-
92
-
93
-
94
-
95
-
96
-
97
-
98
-
99
-
100
-
101
-
102
-
103
-
104
-
105
-
106
-
107
-
108
-
109
-
110
-
111
-
112
-
113
-
114
-
115
-
116
-
117
-
118
-
119
-
120
-
121
-
122
-
123
-
124
-
125
-
126
-
127
-
128
-
129
-
130
-
131
-
132
-
133
-
134
-
135
-
136
-
137
-
138
-
139
-
140
-
141
-
142
-
143
-
144
-
145
-
146
-
147
-
148
-
149
-
150
-
151
-
152
-
153
-
154
-
155
-
156
-
157
-
158
-
159
-
160
-
161
-
162
-
163
-
164
-
165
-
166
-
167
-
168
-
169
-
170
-
171
-
172
-
173
-
174
-
175
-
176
-
177
-
178
-
179
-
180
-
181
-
182
-
183
-
184
-
185
-
186
-
187
-
188
-
189
-
190
-
191
-
192
-
193
-
194
-
195
-
196
-
197
-
198
-
199
-
200
-
201
-
202
-
203
-
204
-
205
-
206
-
207
-
208
-
209
-
210
-
211
-
212
-
213
-
214
-
215
-
216
-
217
-
218
-
219
-
220
-
221
-
222
-
223
-
224
-
225
-
226
-
227
-
228
-
229
-
230
-
231
-
232
-
233
-
234
-
235
-
236
-
237
-
238
-
239
-
240
-
241
-
242
-
243
-
244
-
245
-
246
-
247
-
248
-
249
-
250
-
251
-
252
-
253
-
254
-
255
-
256
-
257
-
258
-
259
-
260
-
261
-
262
-
263
-
264
-
265
-
266
-
267
-
268
-
269
-
270
-
271
-
272
-
273
-
274
-
275
-
276
-
277
-
278
-
279
-
280
-
281
-
282
-
283
-
284
-
285
-
286
-
287
-
288
-
289
-
290
-
291
-
292
-
293
-
294
-
295
-
296
-
297
-
298
-
299
-
300
-
301
-
302
-
303
-
304
-
305
-
306
-
307
-
308
-
309
-
310
-
311
-
312
-
313
-
314
-
315
-
316
-
317
 |
 |

Table of Contents
The $64 million increase in ancillary revenues was due primarily to (i) a $27 million increase in counter sales of insurance and other items,
(ii) a $24 million increase in airport concession and vehicle licensing revenues, which was offset in EBITDA by higher airport concession and
vehicle licensing expenses remitted to airport and other regulatory authorities, and (iii) a $13 million increase in gasoline revenues, which was
offset in EBITDA by $24 million of additional gasoline costs. EBITDA from our domestic car rental operations also reflects (i) $87 million of
additional expenses primarily associated with increased car rental volume and fleet size, including vehicle maintenance and damage costs,
(ii) $43 million of incremental expenses primarily representing inflationary increases in rent, salaries and wages and other costs,
(iii) $28 million of incremental agency-operator and credit card commission expense associated with increased T&M revenue and
(iv) $19 million of separation-related charges we incurred during 2006 primarily related to accelerated vesting of stock-based compensation
awards. Such activity was partially offset by (i) a $26 million decrease in public liability and property damage costs reflecting more favorable
claims experience, (ii) the absence of $12 million of expenses relating to damages caused by the hurricanes experienced in the Gulf Coast in
September 2005, (iii) a $10 million reduction in incentive compensation expenses and (iv) the absence of $10 million of litigation expense
incurred in 2005 resulting from the settlement of a dispute.
International Car Rental
Revenues increased $100 million (15%) while EBITDA was unchanged in 2006 compared with 2005, primarily reflecting growth in rental day
volume and the impact on our 2006 results of franchisees acquired during or subsequent to 2005, as discussed below. Our EBITDA margins
were negatively impacted by higher fleet and interest costs.
The revenue increase of $100 million was comprised of a $69 million (14%) increase in car rental T&M revenue and a $31 million
(18%) increase in ancillary revenues. The increase in T&M revenue was principally driven by a 13% increase in the number of days a car was
rented (which includes 4% organic growth) and a 2% increase in T&M revenue per day. The favorable effect of incremental T&M revenues
was partially offset in EBITDA by $35 million (24%) of increased fleet depreciation and lease charges resulting from an increase of 13% in the
average size of our international rental fleet and increased per-unit fleet costs. We incurred $10 million more vehicle-related interest expense
during 2006 compared to 2005, primarily due to increased interest rates.
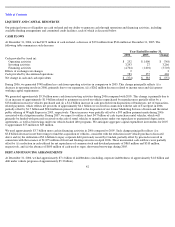
The $31 million increase in ancillary revenues was due primarily to (i) a $16 million increase in counter sales of insurance and other items,
(ii) an $11 million increase in airport concession and vehicle licensing revenues, the majority of which was offset in EBITDA by higher airport
concession and vehicle licensing expenses remitted to airport and other regulatory authorities, and (iii) a $4 million increase in gasoline
revenues, which was partially offset in EBITDA by $1 million of additional gasoline costs. EBITDA also reflects (i) $20 million of higher
operating expenses primarily due to increased car rental volume and fleet size, including vehicle maintenance and damage costs,
(ii) $20 million of incremental expenses primarily representing inflationary increases in rent, salaries and wages and other costs and
(iii) $7 million of incremental agency-operator and credit card commission expense associated with increased T&M revenue. The increases
discussed above also include (i) $55 million of revenue and $1 million of EBITDA losses resulting from our acquisitions of international
franchisees during or subsequent to 2005 and (ii) a $12 million increase in revenue related to favorable foreign currency exchange rate
fluctuations, which was substantially offset in EBITDA by the opposite impact of foreign currency exchange rate fluctuations on expenses.
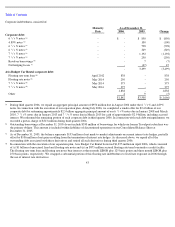
Truck Rental
Revenues and EBITDA declined $74 million (14%) and $58 million (56%), respectively, for 2006 compared with 2005, primarily reflecting
lower rental day volume and lower T&M revenue per day. EBITDA was also impacted by higher fleet costs.
Substantially all of the revenue decrease of $74 million was due to a decrease in T&M revenue, which reflected a 14% reduction in rental days
and a 2% decrease in T&M revenue per day. The 14% reduction in rental days
36