Avis 2006 Annual Report Download - page 79
Download and view the complete annual report
Please find page 79 of the 2006 Avis annual report below. You can navigate through the pages in the report by either clicking on the pages listed below, or by using the keyword search tool below to find specific information within the annual report.-
 1
1 -
2
-
3
-
4
-
5
-
6
-
7
-
8
-
9
-
10
-
11
-
12
-
13
-
14
-
15
-
16
-
17
-
18
-
19
-
20
-
21
-
22
-
23
-
24
-
25
-
26
-
27
-
28
-
29
-
30
-
31
-
32
-
33
-
34
-
35
-
36
-
37
-
38
-
39
-
40
-
41
-
42
-
43
-
44
-
45
-
46
-
47
-
48
-
49
-
50
-
51
-
52
-
53
-
54
-
55
-
56
-
57
-
58
-
59
-
60
-
61
-
62
-
63
-
64
-
65
-
66
-
67
-
68
-
 69
69 -
 70
70 -
 71
71 -
 72
72 -
 73
73 -
 74
74 -
 75
75 -
 76
76 -
 77
77 -
 78
78 -
 79
79 -
 80
80 -
 81
81 -
 82
82 -
 83
83 -
 84
84 -
 85
85 -
 86
86 -
 87
87 -
 88
88 -
 89
89 -
90
-
91
-
92
-
93
-
94
-
95
-
96
-
97
-
98
-
99
-
100
-
101
-
102
-
103
-
104
-
105
-
106
-
107
-
108
-
109
-
110
-
111
-
112
-
113
-
114
-
115
-
116
-
117
-
118
-
119
-
120
-
121
-
122
-
123
-
124
-
125
-
126
-
127
-
128
-
129
-
130
-
131
-
132
-
133
-
134
-
135
-
136
-
137
-
138
-
139
-
140
-
141
-
142
-
143
-
144
-
145
-
146
-
147
-
148
-
149
-
150
-
151
-
152
-
153
-
154
-
155
-
156
-
157
-
158
-
159
-
160
-
161
-
162
-
163
-
164
-
165
-
166
-
167
-
168
-
169
-
170
-
171
-
172
-
173
-
174
-
175
-
176
-
177
-
178
-
179
-
180
-
181
-
182
-
183
-
184
-
185
-
186
-
187
-
188
-
189
-
190
-
191
-
192
-
193
-
194
-
195
-
196
-
197
-
198
-
199
-
200
-
201
-
202
-
203
-
204
-
205
-
206
-
207
-
208
-
209
-
210
-
211
-
212
-
213
-
214
-
215
-
216
-
217
-
218
-
219
-
220
-
221
-
222
-
223
-
224
-
225
-
226
-
227
-
228
-
229
-
230
-
231
-
232
-
233
-
234
-
235
-
236
-
237
-
238
-
239
-
240
-
241
-
242
-
243
-
244
-
245
-
246
-
247
-
248
-
249
-
250
-
251
-
252
-
253
-
254
-
255
-
256
-
257
-
258
-
259
-
260
-
261
-
262
-
263
-
264
-
265
-
266
-
267
-
268
-
269
-
270
-
271
-
272
-
273
-
274
-
275
-
276
-
277
-
278
-
279
-
280
-
281
-
282
-
283
-
284
-
285
-
286
-
287
-
288
-
289
-
290
-
291
-
292
-
293
-
294
-
295
-
296
-
297
-
298
-
299
-
300
-
301
-
302
-
303
-
304
-
305
-
306
-
307
-
308
-
309
-
310
-
311
-
312
-
313
-
314
-
315
-
316
-
317
 |
 |

Table of Contents
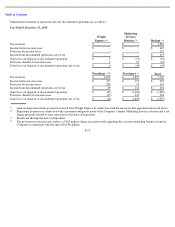
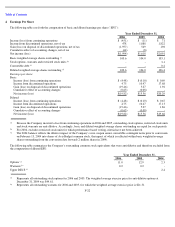
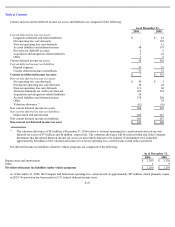
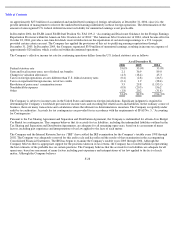
The following table sets forth the computation of basic and diluted earnings per share (“EPS”):
4.
Earnings Per Share
Year Ended December 31,
2006
2005
2004
Income (loss) from continuing operations
$
(451
)
$
(11
)
$
71
Income from discontinued operations, net of tax
478
1,088
1,822
Gain (loss) on disposal of discontinued operations, net of tax
(1,957
)
549
198
Cumulative effect of accounting changes, net of tax
(64
)
(8
)
-
Net income (loss)
$
(1,994
)
$
1,618
$
2,091
Basic weighted average shares outstanding
(a)
100.6
104.0
103.1
Stock options, warrants and restricted stock units
(b)
-
-
3.1
Convertible debt
(c)
-
-
0.2
Diluted weighted average shares outstanding
(a)
100.6
104.0
106.4
Earnings per share:
Basic
Income (loss) from continuing operations
$
(4.48
)
$
(0.10
)
$
0.69
Income from discontinued operations
4.75
10.47
17.68
Gain (loss) on disposal of discontinued operations
(19.46
)
5.27
1.92
Cumulative effect of accounting changes
(0.63
)
(0.08
)
-
Net income (loss)
$
(19.82
)
$
15.56
$
20.29
Diluted
Income (loss) from continuing operations
$
(4.48
)
$
(0.10
)
$
0.67
Income from discontinued operations
4.75
10.47
17.13
Gain (loss) on disposal of discontinued operations
(19.46
)
5.27
1.86
Cumulative effect of accounting changes
(0.63
)
(0.08
)
-
Net income (loss)
$
(19.82
)
$
15.56
$
19.66
(a)
Because the Company incurred a loss from continuing operations in 2006 and 2005, outstanding stock options, restricted stock units
and stock warrants are anti-dilutive. Accordingly, basic and diluted weighted average shares outstanding are equal for such periods.
(b)
For 2004, excludes restricted stock units for which performance based vesting criteria have not been achieved.
The following table summarizes the Company’s outstanding common stock equivalents that were anti-
dilutive and therefore excluded from
the computation of diluted EPS:
(c)
The 2004 balance reflects the dilutive impact of the Company’s zero coupon senior convertible contingent notes prior to conversion
on February 13, 2004 into shares of Avis Budget common stock, the impact of which is reflected within basic weighted average
shares outstanding from the conversion date forward (2 million shares in 2004).
Year Ended December 31,
2006
2005
2004
Options
(a)
11.0
12.9
2.3
Warrants
(b)
0.2
0.2
-
Upper DECS
(c)
-
-
2.4
(a)
Represents all outstanding stock options for 2006 and 2005. The weighted average exercise price for anti-dilutive options at
December 31, 2004 was $44.61.
F
-
22
(b)
Represents all outstanding warrants for 2006 and 2005, for which the weighted average exercise price is $21.31.