Avis 2006 Annual Report Download - page 71
Download and view the complete annual report
Please find page 71 of the 2006 Avis annual report below. You can navigate through the pages in the report by either clicking on the pages listed below, or by using the keyword search tool below to find specific information within the annual report.-
 1
1 -
2
-
3
-
4
-
5
-
6
-
7
-
8
-
9
-
10
-
11
-
12
-
13
-
14
-
15
-
16
-
17
-
18
-
19
-
20
-
21
-
22
-
23
-
24
-
25
-
26
-
27
-
28
-
29
-
30
-
31
-
32
-
33
-
34
-
35
-
36
-
37
-
38
-
39
-
40
-
41
-
42
-
43
-
44
-
45
-
46
-
47
-
48
-
49
-
50
-
51
-
52
-
53
-
54
-
55
-
56
-
57
-
58
-
59
-
60
-
 61
61 -
 62
62 -
 63
63 -
 64
64 -
 65
65 -
 66
66 -
 67
67 -
 68
68 -
 69
69 -
 70
70 -
 71
71 -
 72
72 -
 73
73 -
 74
74 -
 75
75 -
 76
76 -
 77
77 -
 78
78 -
 79
79 -
 80
80 -
 81
81 -
82
-
83
-
84
-
85
-
86
-
87
-
88
-
89
-
90
-
91
-
92
-
93
-
94
-
95
-
96
-
97
-
98
-
99
-
100
-
101
-
102
-
103
-
104
-
105
-
106
-
107
-
108
-
109
-
110
-
111
-
112
-
113
-
114
-
115
-
116
-
117
-
118
-
119
-
120
-
121
-
122
-
123
-
124
-
125
-
126
-
127
-
128
-
129
-
130
-
131
-
132
-
133
-
134
-
135
-
136
-
137
-
138
-
139
-
140
-
141
-
142
-
143
-
144
-
145
-
146
-
147
-
148
-
149
-
150
-
151
-
152
-
153
-
154
-
155
-
156
-
157
-
158
-
159
-
160
-
161
-
162
-
163
-
164
-
165
-
166
-
167
-
168
-
169
-
170
-
171
-
172
-
173
-
174
-
175
-
176
-
177
-
178
-
179
-
180
-
181
-
182
-
183
-
184
-
185
-
186
-
187
-
188
-
189
-
190
-
191
-
192
-
193
-
194
-
195
-
196
-
197
-
198
-
199
-
200
-
201
-
202
-
203
-
204
-
205
-
206
-
207
-
208
-
209
-
210
-
211
-
212
-
213
-
214
-
215
-
216
-
217
-
218
-
219
-
220
-
221
-
222
-
223
-
224
-
225
-
226
-
227
-
228
-
229
-
230
-
231
-
232
-
233
-
234
-
235
-
236
-
237
-
238
-
239
-
240
-
241
-
242
-
243
-
244
-
245
-
246
-
247
-
248
-
249
-
250
-
251
-
252
-
253
-
254
-
255
-
256
-
257
-
258
-
259
-
260
-
261
-
262
-
263
-
264
-
265
-
266
-
267
-
268
-
269
-
270
-
271
-
272
-
273
-
274
-
275
-
276
-
277
-
278
-
279
-
280
-
281
-
282
-
283
-
284
-
285
-
286
-
287
-
288
-
289
-
290
-
291
-
292
-
293
-
294
-
295
-
296
-
297
-
298
-
299
-
300
-
301
-
302
-
303
-
304
-
305
-
306
-
307
-
308
-
309
-
310
-
311
-
312
-
313
-
314
-
315
-
316
-
317
 |
 |

Table of Contents
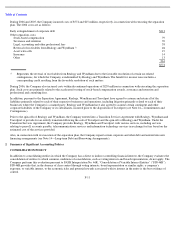
INVESTMENTS
The Company determines the appropriate classification of its investments in debt and equity securities at the time of purchase and
reevaluates such determination at each balance sheet date. The Company’s non-
marketable preferred stock investments are accounted for at
cost plus accretion. Common stock investments in affiliates over which the Company has the ability to exercise significant influence but
not a controlling interest are carried on the equity method of accounting. Available-for-sale securities are carried at current fair value with
unrealized gains or losses reported net of taxes as a separate component of stockholders’ equity. Trading securities are recorded at fair
value with realized and unrealized gains and losses reported currently in earnings.
Aggregate realized gains and losses on investments and preferred dividend income, which amounted to $11 million, $21 million and $40
million in 2006, 2005 and 2004, respectively, are recorded within other revenues on the Consolidated Statements of Operations. Gains and
losses on securities sold are based on the specific identification method.
Affinion Group Holdings, Inc. The Company’s investment in Affinion Group Holdings, Inc. (“Affinion”)
was received in connection with
the October 2005 sale of its former Marketing Services division, along with cash proceeds approximating $1.7 billion. This investment
represents preferred stock with a carrying value of $95 million, including accrued dividends (face value of $125 million) maturing in
October 2017, and warrants with a carrying value of $3 million that are exercisable into 7.5% of the common equity of Affinion upon the
earlier of four years or the achievement of specified investment hurdles.
Pursuant to the Separation Agreement, the Company is obligated to distribute all proceeds received on the sale of its investments in
Affinion to Realogy and Wyndham. Accordingly, following the spin-offs of Realogy and Wyndham on July 31, 2006, the Company began
to recognize a charge on its Consolidated Statement of Operations equal to the dividend and accretion income on the preferred stock of
Affinion. From January 1, 2006 to July 31, 2006, the Company recorded $6 million of dividend and accretion income related to its
preferred stock investment in Affinion. During 2007, the Company sold a portion of its preferred stock investment in Affinion (see Note 24
– Subsequent Event).
Homestore, Inc. The Company’s investment in Homestore, Inc. (“Homestore”)
was received in connection with the February 2001 sale of
its former move.com and ancillary businesses. During 2005 and 2004, the Company sold 7.3 million and 9.8 million, respectively, shares
of Homestore and recognized gains of $18 million and $40 million, respectively, within net revenues on its Consolidated Statements of
Operations. As of December 31, 2005, the Company had sold all of its shares of Homestore stock.
PROPERTY AND EQUIPMENT
Property and equipment (including leasehold improvements) are recorded at cost, net of accumulated depreciation and amortization.
Depreciation, recorded as a component of non-vehicle related depreciation and amortization in the Consolidated Statements of Operations,
is computed utilizing the straight-line method over the estimated useful lives of the related assets. Amortization of leasehold
improvements, also recorded as a component of non-vehicle related depreciation and amortization, is computed utilizing the straight-line
method over the estimated benefit period of the related assets, which may not exceed 20 years, or the lease term, if shorter. Useful lives are
generally 30 years for buildings, three to seven years for capitalized software, three to seven years for furniture, fixtures and equipment and
four to 15 years for buses and support vehicles.
The Company capitalizes the costs of software developed for internal use in accordance with Statement of Position No. 98-1, “Accounting
for the Costs of Computer Software Developed or Obtained for Internal Use.” Capitalization of software developed for internal use
commences during the development phase of the
F
-
14