Avis 2006 Annual Report Download - page 101
Download and view the complete annual report
Please find page 101 of the 2006 Avis annual report below. You can navigate through the pages in the report by either clicking on the pages listed below, or by using the keyword search tool below to find specific information within the annual report.-
 1
1 -
2
-
3
-
4
-
5
-
6
-
7
-
8
-
9
-
10
-
11
-
12
-
13
-
14
-
15
-
16
-
17
-
18
-
19
-
20
-
21
-
22
-
23
-
24
-
25
-
26
-
27
-
28
-
29
-
30
-
31
-
32
-
33
-
34
-
35
-
36
-
37
-
38
-
39
-
40
-
41
-
42
-
43
-
44
-
45
-
46
-
47
-
48
-
49
-
50
-
51
-
52
-
53
-
54
-
55
-
56
-
57
-
58
-
59
-
60
-
61
-
62
-
63
-
64
-
65
-
66
-
67
-
68
-
69
-
70
-
71
-
72
-
73
-
74
-
75
-
76
-
77
-
78
-
79
-
80
-
81
-
82
-
83
-
84
-
85
-
86
-
87
-
88
-
89
-
90
-
 91
91 -
 92
92 -
 93
93 -
 94
94 -
 95
95 -
 96
96 -
 97
97 -
 98
98 -
 99
99 -
 100
100 -
 101
101 -
 102
102 -
 103
103 -
 104
104 -
 105
105 -
 106
106 -
 107
107 -
 108
108 -
 109
109 -
 110
110 -
 111
111 -
112
-
113
-
114
-
115
-
116
-
117
-
118
-
119
-
120
-
121
-
122
-
123
-
124
-
125
-
126
-
127
-
128
-
129
-
130
-
131
-
132
-
133
-
134
-
135
-
136
-
137
-
138
-
139
-
140
-
141
-
142
-
143
-
144
-
145
-
146
-
147
-
148
-
149
-
150
-
151
-
152
-
153
-
154
-
155
-
156
-
157
-
158
-
159
-
160
-
161
-
162
-
163
-
164
-
165
-
166
-
167
-
168
-
169
-
170
-
171
-
172
-
173
-
174
-
175
-
176
-
177
-
178
-
179
-
180
-
181
-
182
-
183
-
184
-
185
-
186
-
187
-
188
-
189
-
190
-
191
-
192
-
193
-
194
-
195
-
196
-
197
-
198
-
199
-
200
-
201
-
202
-
203
-
204
-
205
-
206
-
207
-
208
-
209
-
210
-
211
-
212
-
213
-
214
-
215
-
216
-
217
-
218
-
219
-
220
-
221
-
222
-
223
-
224
-
225
-
226
-
227
-
228
-
229
-
230
-
231
-
232
-
233
-
234
-
235
-
236
-
237
-
238
-
239
-
240
-
241
-
242
-
243
-
244
-
245
-
246
-
247
-
248
-
249
-
250
-
251
-
252
-
253
-
254
-
255
-
256
-
257
-
258
-
259
-
260
-
261
-
262
-
263
-
264
-
265
-
266
-
267
-
268
-
269
-
270
-
271
-
272
-
273
-
274
-
275
-
276
-
277
-
278
-
279
-
280
-
281
-
282
-
283
-
284
-
285
-
286
-
287
-
288
-
289
-
290
-
291
-
292
-
293
-
294
-
295
-
296
-
297
-
298
-
299
-
300
-
301
-
302
-
303
-
304
-
305
-
306
-
307
-
308
-
309
-
310
-
311
-
312
-
313
-
314
-
315
-
316
-
317
 |
 |

Table of Contents
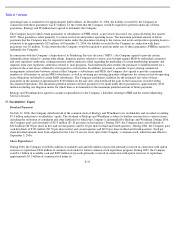
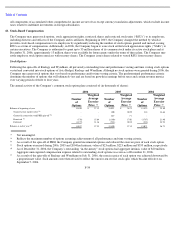
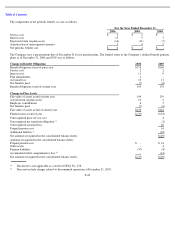
The following assumptions, calculated on a weighted-average basis, were used to determine pension obligations and pension costs for the
principal plans in which the Company’s employees participated:
To select a discount rate for its defined benefit pension plans, the Company uses a modeling process that involves matching the expected
cash outflows of such plan, to a yield curve constructed from a portfolio of AA rated fixed-income debt instruments. The Company uses
the average yield of this hypothetical portfolio as a discount rate benchmark.
The Company’s expected rate of return on plan assets of 8.25% is a long term rate based on historic plan asset returns over varying long
term periods combined with current market conditions and broad asset mix considerations. The expected rate of return is a long term
assumption and generally does not change annually.
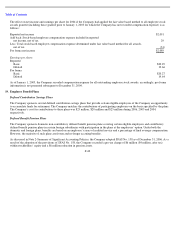
As of December 31, 2006 substantially all of the Company’s defined benefit pension plans had a projected benefit obligation in excess of
the fair value of plan assets. The Company expects to contribute approximately $8 million to these plans in 2007.
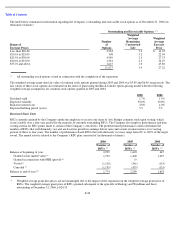
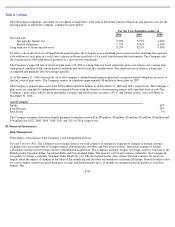
The Company’s pension plan assets were $156 million and $144 million as of December 31, 2006 and 2005, respectively. The Company’s
plan assets are managed by independent investment advisors with the objective of maximizing returns with a prudent level of risk. The
Company’s plan assets, which consist principally of equity and fixed income securities of U.S. and foreign issuers, were as follows at
December 31, 2006.
The Company estimates that future benefit payments from plan assets will be $8 million, $8 million, $8 million, $9 million, $9 million and
$54 million for 2007, 2008, 2009, 2010, 2011 and 2011 to 2016, respectively.
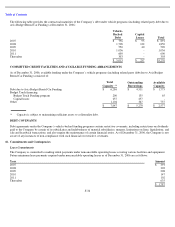
20. Financial Instruments
Risk Management
Following is a description of the Company’s risk management policies.
Foreign Currency Risk. The Company uses foreign currency forward contracts to manage its exposure to changes in foreign currency
exchange rates associated with its foreign currency denominated receivables and forecasted royalties, forecasted earnings of foreign
subsidiaries and forecasted foreign currency denominated acquisitions. The Company primarily hedges its foreign currency exposure to the
British pound, Canadian dollar, Australian dollar and New Zealand dollar. The majority of forward contracts utilized by the Company do
not qualify for hedge accounting treatment under SFAS No. 133. The fluctuations in the value of these forward contracts do, however,
largely offset the impact of changes in the value of the underlying risk that they are intended to economically hedge. Forward contracts that
are used to hedge certain forecasted third party receipts and disbursements up to 12 months are designated and do qualify as cash flow
hedges. The
F
-
44
For the Year Ended December 31,
2006
2005
2004
Discount rate:
Net periodic benefit cost
5.50
%
5.75
%
6.00
%
Benefit obligation
5.75
%
5.50
%
6.00
%
Long
-
term rate of return on plan assets
8.25
%
8.25
%
8.50
%
Asset Category
Equity
62
%
Fixed Income
35
%
Real Estate
3
%