Avis 2006 Annual Report Download - page 107
Download and view the complete annual report
Please find page 107 of the 2006 Avis annual report below. You can navigate through the pages in the report by either clicking on the pages listed below, or by using the keyword search tool below to find specific information within the annual report.-
 1
1 -
2
-
3
-
4
-
5
-
6
-
7
-
8
-
9
-
10
-
11
-
12
-
13
-
14
-
15
-
16
-
17
-
18
-
19
-
20
-
21
-
22
-
23
-
24
-
25
-
26
-
27
-
28
-
29
-
30
-
31
-
32
-
33
-
34
-
35
-
36
-
37
-
38
-
39
-
40
-
41
-
42
-
43
-
44
-
45
-
46
-
47
-
48
-
49
-
50
-
51
-
52
-
53
-
54
-
55
-
56
-
57
-
58
-
59
-
60
-
61
-
62
-
63
-
64
-
65
-
66
-
67
-
68
-
69
-
70
-
71
-
72
-
73
-
74
-
75
-
76
-
77
-
78
-
79
-
80
-
81
-
82
-
83
-
84
-
85
-
86
-
87
-
88
-
89
-
90
-
91
-
92
-
93
-
94
-
95
-
96
-
 97
97 -
 98
98 -
 99
99 -
 100
100 -
 101
101 -
 102
102 -
 103
103 -
 104
104 -
 105
105 -
 106
106 -
 107
107 -
 108
108 -
 109
109 -
 110
110 -
 111
111 -
 112
112 -
 113
113 -
 114
114 -
 115
115 -
 116
116 -
 117
117 -
118
-
119
-
120
-
121
-
122
-
123
-
124
-
125
-
126
-
127
-
128
-
129
-
130
-
131
-
132
-
133
-
134
-
135
-
136
-
137
-
138
-
139
-
140
-
141
-
142
-
143
-
144
-
145
-
146
-
147
-
148
-
149
-
150
-
151
-
152
-
153
-
154
-
155
-
156
-
157
-
158
-
159
-
160
-
161
-
162
-
163
-
164
-
165
-
166
-
167
-
168
-
169
-
170
-
171
-
172
-
173
-
174
-
175
-
176
-
177
-
178
-
179
-
180
-
181
-
182
-
183
-
184
-
185
-
186
-
187
-
188
-
189
-
190
-
191
-
192
-
193
-
194
-
195
-
196
-
197
-
198
-
199
-
200
-
201
-
202
-
203
-
204
-
205
-
206
-
207
-
208
-
209
-
210
-
211
-
212
-
213
-
214
-
215
-
216
-
217
-
218
-
219
-
220
-
221
-
222
-
223
-
224
-
225
-
226
-
227
-
228
-
229
-
230
-
231
-
232
-
233
-
234
-
235
-
236
-
237
-
238
-
239
-
240
-
241
-
242
-
243
-
244
-
245
-
246
-
247
-
248
-
249
-
250
-
251
-
252
-
253
-
254
-
255
-
256
-
257
-
258
-
259
-
260
-
261
-
262
-
263
-
264
-
265
-
266
-
267
-
268
-
269
-
270
-
271
-
272
-
273
-
274
-
275
-
276
-
277
-
278
-
279
-
280
-
281
-
282
-
283
-
284
-
285
-
286
-
287
-
288
-
289
-
290
-
291
-
292
-
293
-
294
-
295
-
296
-
297
-
298
-
299
-
300
-
301
-
302
-
303
-
304
-
305
-
306
-
307
-
308
-
309
-
310
-
311
-
312
-
313
-
314
-
315
-
316
-
317
 |
 |

Table of Contents
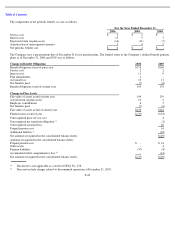
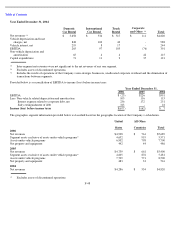
(a)
EBITDA for first, second, third and fourth quarter 2006 includes $25 million, $31 million, $167 million and $38 million,
respectively, of separation costs.
F
-
50
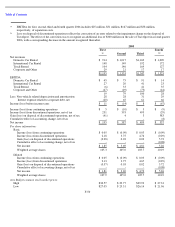
(b)
Loss on disposal of discontinued operations reflects the correction of an error related to the impairment charge on the disposal of
Travelport. The effect of the correction was to recognize an additional loss of $300 million on the sale of Travelport in second quarter
2006, with a corresponding decrease in the amount recognized thereafter.
2005
First
(a)
Second
Third
Fourth
(b)
Net revenues
Domestic Car Rental
$
914
$
1,017
$
1,169
$
1,009
International Car Rental
148
149
192
172
Truck Rental
104
146
169
127
Corporate and Other
29
21
17
17
$
1,195
$
1,333
$
1,547
$
1,325
EBITDA
Domestic Car Rental
$
45
$
75
$
91
$
14
International Car Rental
27
20
41
23
Truck Rental
(6
)
33
41
35
Corporate and Other
(47
)
(49
)
(73
)
(44
)
19
79
100
28
Less: Non
-
vehicle related depreciation and amortization
28
28
31
29
Interest expense related to corporate debt, net
(20
)
65
61
66
Income (loss) before income taxes
$
11
$
(14
)
$
8
$
(67
)
Income (loss) from continuing operations
$
5
$
(10
)
$
3
$
(9
)
Income (loss) from discontinued operations, net of tax
231
393
493
(29
)
Gain (loss) on disposal of discontinued operations, net of tax
(41
)
4
3
583
Cumulative effect of accounting change, net of tax
-
-
-
(8
)
Net income
$
195
$
387
$
499
$
537
Per share information:
Basic
Income (loss) from continuing operations
$
0.05
$
(0.09
)
$
0.03
$
(0.09
)
Income (loss) from discontinued operations
2.18
3.75
4.76
(0.29
)
Gain (loss) on disposal of discontinued operations
(0.38
)
0.03
0.02
5.72
Cumulative effect of accounting change, net of tax
-
-
-
(0.08
)
Net income
$
1.85
$
3.69
$
4.81
5.26
Weighted average shares
105.3
105.0
103.7
101.9
Diluted
Income (loss) from continuing operations
$
0.05
$
(0.09
)
$
0.03
$
(0.09
)
Income (loss) from discontinued operations
2.13
3.75
4.67
(0.29
)
Gain (loss) on disposal of discontinued operations
(0.37
)
0.03
0.02
5.72
Cumulative effect of accounting change, net of tax
-
-
-
(0.08
)
Net income
$
1.81
$
3.69
$
4.72
$
5.26
Weighted average shares
107.9
105.0
105.7
101.9
Avis Budget common stock market prices:
High
$
30.57
$
29.77
$
29.93
$
27.33
Low
$
27.05
$
25.51
$
26.14
$
21.96