eTrade 2000 Annual Report Download - page 19
Download and view the complete annual report
Please find page 19 of the 2000 eTrade annual report below. You can navigate through the pages in the report by either clicking on the pages listed below, or by using the keyword search tool below to find specific information within the annual report.-
 1
1 -
2
-
3
-
4
-
5
-
6
-
7
-
8
-
 9
9 -
 10
10 -
 11
11 -
 12
12 -
 13
13 -
 14
14 -
 15
15 -
 16
16 -
 17
17 -
 18
18 -
 19
19 -
 20
20 -
 21
21 -
 22
22 -
 23
23 -
 24
24 -
 25
25 -
 26
26 -
 27
27 -
 28
28 -
 29
29 -
30
-
31
-
32
-
33
-
34
-
35
-
36
-
37
-
38
-
39
-
40
-
41
-
42
-
43
-
44
-
45
-
46
-
47
-
48
-
49
-
50
-
51
-
52
-
53
-
54
-
55
-
56
-
57
-
58
-
59
-
60
-
61
-
62
-
63
-
64
-
65
-
66
-
67
-
68
-
69
-
70
-
71
-
72
-
73
-
74
-
75
-
76
-
77
-
78
-
79
-
80
-
81
-
82
-
83
-
84
-
85
-
86
-
87
-
88
-
89
-
90
-
91
-
92
-
93
-
94
-
95
-
96
-
97
-
98
-
99
-
100
-
101
-
102
-
103
-
104
-
105
-
106
-
107
-
108
-
109
-
110
-
111
-
112
-
113
-
114
-
115
-
116
-
117
-
118
-
119
-
120
-
121
-
122
-
123
-
124
-
125
-
126
-
127
-
128
-
129
-
130
-
131
-
132
-
133
-
134
-
135
-
136
-
137
-
138
-
139
-
140
-
141
-
142
-
143
-
144
-
145
-
146
-
147
-
148
-
149
-
150
-
151
-
152
-
153
-
154
-
155
-
156
-
157
-
158
-
159
-
160
-
161
-
162
-
163
-
164
-
165
-
166
-
167
-
168
-
169
-
170
-
171
-
172
-
173
-
174
-
175
-
176
-
177
-
178
-
179
-
180
-
181
-
182
-
183
-
184
-
185
-
186
-
187
-
188
-
189
-
190
-
191
-
192
-
193
-
194
-
195
-
196
-
197
-
198
-
199
-
200
-
201
-
202
-
203
-
204
-
205
-
206
-
207
-
208
-
209
-
210
-
211
-
212
-
213
-
214
-
215
-
216
-
217
-
218
-
219
-
220
-
221
-
222
-
223
-
224
-
225
-
226
-
227
-
228
-
229
-
230
-
231
-
232
-
233
-
234
-
235
-
236
-
237
-
238
-
239
-
240
-
241
-
242
-
243
-
244
-
245
-
246
-
247
-
248
-
249
-
250
-
251
-
252
-
253
-
254
-
255
-
256
-
257
-
258
-
259
-
260
-
261
-
262
-
263
 |
 |

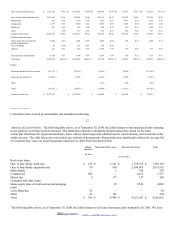
Certificates of
deposit
2,876,229 85.10 6.32 %
1,142,326 77.67 5.88 %
Brokered callable
certificates of
deposit
88,601 2.62 6.43 %
67,085 4.56 6.62 %
Total $ 3,379,818 100.00 %
$ 1,470,660 100.00 %
The following table classifies our certificates of deposit and money market accounts by rate at the dates indicated.
September 30, 2000 September 30, 1999
(in thousands)
0-1.99% $ 1,489 $ 1,594
2-3.99% 711 288
4-5.99% 687,983 1,440,573
6-7.99% 3,868,892 674,341
8-9.99% 24,941 610
10-11.99% 3 11
12-20.00% 9 12
$ 4,584,028 $ 2,117,429
The following table classifies the amount of our large certificates of deposit, i.e., in amounts of $100,000 or more, by time remaining
until maturity, as of September 30, 2000.
Certificates of Deposit
(in thousands)
Three months or less $ 22,389
Three through six months 50,936
Six through twelve months 290,194
Over twelve months 226,864
Total $ 590,383
Borrowings
Although deposits are our primary source of funds, we also borrow from the FHLB of Atlanta and sell securities under agreements to
repurchase to acquire additional funding. We are a member of the FHLB system, which, among other things, functions in a reserve
credit capacity for savings institutions. This membership requires us to own capital stock in the FHLB of Atlanta. It also authorizes us
to apply for advances on the security of FHLB stock and various home mortgages and other assets—principally securities that are
obligations of, or guaranteed by, the United States government—provided we meet certain creditworthiness standards.
As of September 30, 2000, our outstanding advances from the FHLB of Atlanta totaled $1.6 billion at interest rates ranging from
4.58% to 6.96% and at a weighted average rate of 6.47%.
We also borrow funds by selling securities to nationally recognized investment banking firms under agreements to repurchase the same
securities. The investment banking firms hold the securities in custody. We treat repurchase agreements as borrowings and secure them
with designated fixed- and variable-rate securities. We use the proceeds of these transactions to meet our cash flow or asset/liability
matching needs.
20
The following table presents information regarding repurchase agreements for the dates indicated.
September 30, 2000 September 30, 1999 September 30, 1998
(dollars in thousands)
Weighted average balance during the year $ 1,471,435 $ 555,552 $ 259,846
2002. EDGAR Online, Inc.