eTrade 2000 Annual Report Download - page 18
Download and view the complete annual report
Please find page 18 of the 2000 eTrade annual report below. You can navigate through the pages in the report by either clicking on the pages listed below, or by using the keyword search tool below to find specific information within the annual report.-
 1
1 -
2
-
3
-
4
-
5
-
6
-
7
-
 8
8 -
 9
9 -
 10
10 -
 11
11 -
 12
12 -
 13
13 -
 14
14 -
 15
15 -
 16
16 -
 17
17 -
 18
18 -
 19
19 -
 20
20 -
 21
21 -
 22
22 -
 23
23 -
 24
24 -
 25
25 -
 26
26 -
 27
27 -
 28
28 -
29
-
30
-
31
-
32
-
33
-
34
-
35
-
36
-
37
-
38
-
39
-
40
-
41
-
42
-
43
-
44
-
45
-
46
-
47
-
48
-
49
-
50
-
51
-
52
-
53
-
54
-
55
-
56
-
57
-
58
-
59
-
60
-
61
-
62
-
63
-
64
-
65
-
66
-
67
-
68
-
69
-
70
-
71
-
72
-
73
-
74
-
75
-
76
-
77
-
78
-
79
-
80
-
81
-
82
-
83
-
84
-
85
-
86
-
87
-
88
-
89
-
90
-
91
-
92
-
93
-
94
-
95
-
96
-
97
-
98
-
99
-
100
-
101
-
102
-
103
-
104
-
105
-
106
-
107
-
108
-
109
-
110
-
111
-
112
-
113
-
114
-
115
-
116
-
117
-
118
-
119
-
120
-
121
-
122
-
123
-
124
-
125
-
126
-
127
-
128
-
129
-
130
-
131
-
132
-
133
-
134
-
135
-
136
-
137
-
138
-
139
-
140
-
141
-
142
-
143
-
144
-
145
-
146
-
147
-
148
-
149
-
150
-
151
-
152
-
153
-
154
-
155
-
156
-
157
-
158
-
159
-
160
-
161
-
162
-
163
-
164
-
165
-
166
-
167
-
168
-
169
-
170
-
171
-
172
-
173
-
174
-
175
-
176
-
177
-
178
-
179
-
180
-
181
-
182
-
183
-
184
-
185
-
186
-
187
-
188
-
189
-
190
-
191
-
192
-
193
-
194
-
195
-
196
-
197
-
198
-
199
-
200
-
201
-
202
-
203
-
204
-
205
-
206
-
207
-
208
-
209
-
210
-
211
-
212
-
213
-
214
-
215
-
216
-
217
-
218
-
219
-
220
-
221
-
222
-
223
-
224
-
225
-
226
-
227
-
228
-
229
-
230
-
231
-
232
-
233
-
234
-
235
-
236
-
237
-
238
-
239
-
240
-
241
-
242
-
243
-
244
-
245
-
246
-
247
-
248
-
249
-
250
-
251
-
252
-
253
-
254
-
255
-
256
-
257
-
258
-
259
-
260
-
261
-
262
-
263
 |
 |

September 30, 2000 September 30, 1999 September 30, 1998
Cost Basis Fair Value Cost Basis Fair Value Cost Basis Fair Value
(in thousands)
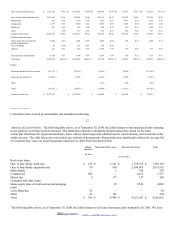
Available-for-sale investment
securities:
Municipal bonds $ 15,005 $ 13,945 $ 15,605 $ 14,390 $ 15,750 $ 16,028
Corporate bonds 272,431 265,066 130,166 122,559 154,534 153,205
Obligations of U.S. government
agencies
13,291 12,898 18,264 18,018 26,661 27,992
Asset-backed 23,661 23,660 915 921 1,095 1,119
Preferred stock in Freddie Mac 5,000 4,356 5,000 4,950 5,000 4,988
Preferred stock in Fannie Mae — — — — 8,000 8,394
Other corporate stock 4,438 4,363 3,980 3,980 937 1,000
Other investments 12,318 12,036 13,967 13,804 7,814 7,632
Total $ 346,144 $ 336,324 $ 187,897 $ 178,622 $ 219,791 $ 220,358
In addition to the available-for-sale investment securities listed above, we have an investment in the stock of the Federal Home Loan
Bank (“FHLB”) of Atlanta. The stock is recorded on our books at cost, which approximates fair value. The balance of FHLB stock
was $83.3 million and $29.4 million at September 30, 2000 and September 30, 1999, respectively.
The following table shows the scheduled maturities, carrying values, and current yields for our banking-related investment portfolio of
debt and equity securities at September 30, 2000.
Within One Year After One But Within
Five Years
After Five But Within Ten Years After Ten Years Totals
Balance Due Weighted
Average Yield
Balance Due Weighted
Average Yield
Balance Due Weighted
Average Yield
Balance Due Weighted
Average Yield
Balance Due Weighted
Average Yield
(dollars in thousands)
Municipal
bonds(1)
$ — — %
$ 230 4.20 %
$ 1,732 4.77 %
$ 11,983 5.87 %
$ 13,945 5.71 %
Corporate debt 29,696 6.67 %
44,109 6.28 %
26,676 4.43 %
164,585 6.78 %
265,066 6.45 %
Obligations of
U.S.
government
agencies
— — %
— — %
— — %
12,898 6.10 %
12,898 6.10 %
Asset-backed — — %
407 6.19 %
19,296 4.68 %
3,957 7.39 %
23,660 5.16 %
Other investments 14,637 6.84 %
4,889 10.99 %
— — %
1,229 7.15 %
20,755 7.84 %
$ 44,333 6.73 %
$ 49,635 6.73 %
$ 47,704 4.54 %
$ 194,652 6.69 %
$ 336,324 6.40 %
______________
(1) Yields on tax exempt obligations are computed on a tax equivalent basis.
19
Deposits and Other Sources of Funds
The following table presents information about the various categories of the Bank’ s deposits for the periods indicated.
Average Balance for the Year
Ended September 30, 2000
Percentage of
Deposits
Average Rate Average Balance for the Year
Ended September 30, 1999
Percentage of
Deposits
Average
Rate
(dollars in thousands)
Passbook $ 498 0.02 %
2.48 %
$ 563 0.04 %
3.00 %
Money market 178,174 5.27 4.84 %
238,031 16.19 4.80 %
Demand accounts 236,316 6.99 3.68 %
22,655 1.54 3.86 %
2002. EDGAR Online, Inc.