eTrade 2000 Annual Report Download - page 17
Download and view the complete annual report
Please find page 17 of the 2000 eTrade annual report below. You can navigate through the pages in the report by either clicking on the pages listed below, or by using the keyword search tool below to find specific information within the annual report.-
 1
1 -
2
-
3
-
4
-
5
-
6
-
 7
7 -
 8
8 -
 9
9 -
 10
10 -
 11
11 -
 12
12 -
 13
13 -
 14
14 -
 15
15 -
 16
16 -
 17
17 -
 18
18 -
 19
19 -
 20
20 -
 21
21 -
 22
22 -
 23
23 -
 24
24 -
 25
25 -
 26
26 -
 27
27 -
28
-
29
-
30
-
31
-
32
-
33
-
34
-
35
-
36
-
37
-
38
-
39
-
40
-
41
-
42
-
43
-
44
-
45
-
46
-
47
-
48
-
49
-
50
-
51
-
52
-
53
-
54
-
55
-
56
-
57
-
58
-
59
-
60
-
61
-
62
-
63
-
64
-
65
-
66
-
67
-
68
-
69
-
70
-
71
-
72
-
73
-
74
-
75
-
76
-
77
-
78
-
79
-
80
-
81
-
82
-
83
-
84
-
85
-
86
-
87
-
88
-
89
-
90
-
91
-
92
-
93
-
94
-
95
-
96
-
97
-
98
-
99
-
100
-
101
-
102
-
103
-
104
-
105
-
106
-
107
-
108
-
109
-
110
-
111
-
112
-
113
-
114
-
115
-
116
-
117
-
118
-
119
-
120
-
121
-
122
-
123
-
124
-
125
-
126
-
127
-
128
-
129
-
130
-
131
-
132
-
133
-
134
-
135
-
136
-
137
-
138
-
139
-
140
-
141
-
142
-
143
-
144
-
145
-
146
-
147
-
148
-
149
-
150
-
151
-
152
-
153
-
154
-
155
-
156
-
157
-
158
-
159
-
160
-
161
-
162
-
163
-
164
-
165
-
166
-
167
-
168
-
169
-
170
-
171
-
172
-
173
-
174
-
175
-
176
-
177
-
178
-
179
-
180
-
181
-
182
-
183
-
184
-
185
-
186
-
187
-
188
-
189
-
190
-
191
-
192
-
193
-
194
-
195
-
196
-
197
-
198
-
199
-
200
-
201
-
202
-
203
-
204
-
205
-
206
-
207
-
208
-
209
-
210
-
211
-
212
-
213
-
214
-
215
-
216
-
217
-
218
-
219
-
220
-
221
-
222
-
223
-
224
-
225
-
226
-
227
-
228
-
229
-
230
-
231
-
232
-
233
-
234
-
235
-
236
-
237
-
238
-
239
-
240
-
241
-
242
-
243
-
244
-
245
-
246
-
247
-
248
-
249
-
250
-
251
-
252
-
253
-
254
-
255
-
256
-
257
-
258
-
259
-
260
-
261
-
262
-
263
 |
 |

mortgage-backed pass-through securities, the nature of the CMO bonds acquired, primarily sequential pay bonds, provides for more
predictable cash flows than the mortgage-backed securities. This reduces the duration risk, extension risk and price volatility of the
CMO compared to mortgage-backed pass-through securities and thus allows us to target liabilities with shorter durations.
In accordance with Statement of Financial Accounting Standard (“SFAS”) No. 115, Accounting for Certain Investments in Debt and
Equity Securities , we classify our mortgage-backed securities in one of three categories: held-to-maturity, available-for-sale or
trading. During fiscal 2000, 1999 and 1998, we held no mortgage-backed securities classified as held-to-maturity.
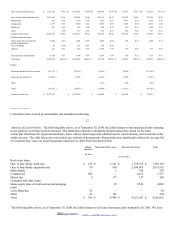
The following table shows the activity in our available-for-sale mortgage-backed securities portfolio during the periods indicated.
Years Ended September 30,
2000 1999 1998
(in thousands)
Mortgage-backed securities at beginning of period $ 1,426,053 $ 798,860 $ 319,203
Purchases:
Pass-through securities — — 22,776
CMOs 3,579,379 1,159,652 1,092,487
Fannie Mae 590,236 92,378 8,405
Ginnie Mae 8,891 — 5,890
Freddie Mac 173,732 — 11,759
Other — — 19,586
Sales(1) (1,140,935 ) (285,414 ) (294,161 )
Repayments (463,985 ) (332,092 ) (174,398 )
Transfer to trading — — (332 )
Mark-to-market adjustments and deferred hedging gains/losses 15,182 (7,331 ) 948
Mortgage-backed securities at end of period $ 4,188,553 $ 1,426,053 $ 1,012,163
______________
(1) Includes mortgage-backed securities on which call options have been exercised.
We buy and hold trading securities principally for the purpose of selling them in the near term. We carry these securities at market
value with unrealized gains and losses recognized in income. At September 30, 2000, 1999 and 1998, we held $3.4 million, $38.3
million and $29.6 million of trading securities, respectively. For fiscal 2000, 1999 and 1998, we also recognized $750,000, $1.4
million, and $569,000, respectively, in realized gains from the sale of trading assets and $195,000, ($1.3) million, and ($612,000),
respectively, in unrealized appreciation (depreciation) of trading assets.
18
The following table shows the scheduled maturities, carrying values, and current yields for our portfolio of mortgage-backed
securities, both available-for-sale and trading, at September 30, 2000.
After One But Within Five
Years
After Five But Within Ten Years After Ten Years Totals
Balance
Due
Weighted
Yield
Balance Due Weighted
Yield
Balance Due Weighted
Yield
Balance Due Weighted
Yield
(dollars in thousands)
Private
issuer
$ 73 7.50 %
$ — — %
$ 47,805 8.46 %
$ 47,878 8.46 %
CMO’ s — — %
14,725 5.85 %
3,351,634 7.77 %
3,366,359 7.76 %
Agencies 62 8.64 %
— — %
777,624 7.49 %
777,686 7.49 %
$ 135 8.02 %
$ 14,725 5.85 %
$ 4,177,063 7.73 %
$ 4,191,923 7.72 %
Investment Securities
The following table shows the cost basis and fair value of our banking-related investment portfolio other than mortgage-backed
securities at the dates indicated. The following table does not include investment securities we hold arising from our non-banking
business segments. Consolidated information on all investment securities we hold is presented in “Item 8. Consolidated Financial
Statements and Supplementary Data.”
2002. EDGAR Online, Inc.