eTrade 2000 Annual Report Download - page 15
Download and view the complete annual report
Please find page 15 of the 2000 eTrade annual report below. You can navigate through the pages in the report by either clicking on the pages listed below, or by using the keyword search tool below to find specific information within the annual report.-
 1
1 -
2
-
3
-
4
-
 5
5 -
 6
6 -
 7
7 -
 8
8 -
 9
9 -
 10
10 -
 11
11 -
 12
12 -
 13
13 -
 14
14 -
 15
15 -
 16
16 -
 17
17 -
 18
18 -
 19
19 -
 20
20 -
 21
21 -
 22
22 -
 23
23 -
 24
24 -
 25
25 -
26
-
27
-
28
-
29
-
30
-
31
-
32
-
33
-
34
-
35
-
36
-
37
-
38
-
39
-
40
-
41
-
42
-
43
-
44
-
45
-
46
-
47
-
48
-
49
-
50
-
51
-
52
-
53
-
54
-
55
-
56
-
57
-
58
-
59
-
60
-
61
-
62
-
63
-
64
-
65
-
66
-
67
-
68
-
69
-
70
-
71
-
72
-
73
-
74
-
75
-
76
-
77
-
78
-
79
-
80
-
81
-
82
-
83
-
84
-
85
-
86
-
87
-
88
-
89
-
90
-
91
-
92
-
93
-
94
-
95
-
96
-
97
-
98
-
99
-
100
-
101
-
102
-
103
-
104
-
105
-
106
-
107
-
108
-
109
-
110
-
111
-
112
-
113
-
114
-
115
-
116
-
117
-
118
-
119
-
120
-
121
-
122
-
123
-
124
-
125
-
126
-
127
-
128
-
129
-
130
-
131
-
132
-
133
-
134
-
135
-
136
-
137
-
138
-
139
-
140
-
141
-
142
-
143
-
144
-
145
-
146
-
147
-
148
-
149
-
150
-
151
-
152
-
153
-
154
-
155
-
156
-
157
-
158
-
159
-
160
-
161
-
162
-
163
-
164
-
165
-
166
-
167
-
168
-
169
-
170
-
171
-
172
-
173
-
174
-
175
-
176
-
177
-
178
-
179
-
180
-
181
-
182
-
183
-
184
-
185
-
186
-
187
-
188
-
189
-
190
-
191
-
192
-
193
-
194
-
195
-
196
-
197
-
198
-
199
-
200
-
201
-
202
-
203
-
204
-
205
-
206
-
207
-
208
-
209
-
210
-
211
-
212
-
213
-
214
-
215
-
216
-
217
-
218
-
219
-
220
-
221
-
222
-
223
-
224
-
225
-
226
-
227
-
228
-
229
-
230
-
231
-
232
-
233
-
234
-
235
-
236
-
237
-
238
-
239
-
240
-
241
-
242
-
243
-
244
-
245
-
246
-
247
-
248
-
249
-
250
-
251
-
252
-
253
-
254
-
255
-
256
-
257
-
258
-
259
-
260
-
261
-
262
-
263
 |
 |

In establishing the allowance for loan losses, we set up specific allowances for probable losses that we have identified on specific
loans. Additionally, we provide an unallocated allowance for estimated expected losses in the remainder of the loan portfolio. The
allowances established by management are subject to review and approval by the Bank’ s board of directors. Each month, we review
the allowance for adequacy, based on our assessment of the risk in our loan portfolio as a whole, considering the following factors:
the composition and quality of the portfolio;
delinquency trends;
current charge-off and loss experience;
the state of the real estate market; and
general economic conditions.
During fiscal 2000, we recorded a net increase of $3.8 million in the allowance for loan losses. The increase resulted from an
additional provision of $4.0 million, offset by net charge-offs of $234,000. As of September 30, 2000, the total allowance for loan
losses was $10.9 million, of which $391,000 represented reserves established by management for probable losses on specific loans.
The general allowance is computed on loans with a specific allowance based on an assessment of performing loans. Each month, the
performing loan portfolio is stratified by asset type—one- to four-family, commercial, consumer, etc.—and a range of expected loss
ratios is applied to each type of loan. Expected loss ratios range between 15 basis points and 300 basis points depending upon asset
type, loan-to-value ratio and current market and economic conditions. The expected loss ratios are based on historical loss experience,
adjusted to reflect industry loss experience as published by the OTS.
Also considered in the reserve computation is the positive impact of loans acquired that have a seller or third party credit
enhancement. As of September 30, 2000, total loans receivable included nine pools of credit-enhanced one- to four-family mortgage
loans totaling $30.9 million, or 0.74%, of total gross loans outstanding. Reserves are not provided for loans in which the credit
enhancement amount exceeds the amount of reserves that would otherwise be required. We have purchased certain loans with an
expectation that not all contractual payments of the loan will be collected. Discounts attributable to credit issues are tracked separately
and are not included as a component of the allowance for loan losses.
The loan portfolio provision recorded for fiscal 2000 was based upon the level of charge-offs and the significant growth in the
portfolio. We believe that the combination of our loan loss allowance, net credit discount, and credit enhancement on certain loan
pools is adequate to cover estimated losses.
16
We believe that we have established our existing loss allowances in accordance with generally accepted accounting principles.
However, circumstances may change, regulators may request us to increase our allowance for losses. Such an increase could negatively
affect our financial condition and earnings. The increase in the allowance for loan losses reflects the significant increase in the loan
portfolio, from $2,184 million at September 30, 1999 to $4,226 million at September 30, 2000, and the fact that the Bank purchases,
rather than originates in house, the majority of its loans. Even though our historic charge-offs are minimal, $253,000 and $458,000 in
fiscal 2000 and1999, respectively, we believe the allowance for loan losses, $10.9 million (0.26% of total loans) and $7.2 million
(0.33% of total loans) at September 30, 2000 and 1999, respectively, is an appropriate estimate of the losses inherent in the loan
portfolio.
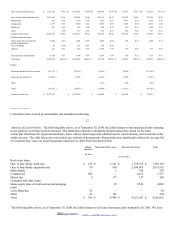
The following table allocates the allowance for loan losses by loan category at the dates indicated. This allocation does not necessarily
restrict the use of the allowance to absorb losses in any other category. The table also shows the percentage of total loans that each
loan category represents.
September 30, 2000 September 30, 1999 September 30, 1998 September 30, 1997 September 30, 1996
Amount Percent of
Loans in
Each
Category to
Total Loans
Amount Percent of
Loans in
Each
Category to
Total Loans
Amount Percent of
Loans in
Each
Category to
Total Loans
Amount Percent of
Loans in
Each
Category to
Total Loans
Amount Percent of
Loans in
Each
Category to
Total Loans
(dollars in thousands)
Real estate loans:
One- to four-family $ 10,554 99.81 %
$ 7,055 99.67 %
$ 4,089 97.55 %
$ 3,271 98.80 %
$ 2,529 97.56 %
Multi-family 3 0.01 23 0.06 32 0.35 15 0.26 15 0.41
Commercial 336 0.06 53 0.14 520 0.97 286 0.55 373 1.09
Mixed-use 8 0.01 17 0.04 9 0.10 9 0.15 12 0.32
2002. EDGAR Online, Inc.