eBay 2015 Annual Report Download - page 96
Download and view the complete annual report
Please find page 96 of the 2015 eBay annual report below. You can navigate through the pages in the report by either clicking on the pages listed below, or by using the keyword search tool below to find specific information within the annual report.-
 1
1 -
2
-
3
-
4
-
5
-
6
-
7
-
8
-
9
-
10
-
11
-
12
-
13
-
14
-
15
-
16
-
17
-
18
-
19
-
20
-
21
-
22
-
23
-
24
-
25
-
26
-
27
-
28
-
29
-
30
-
31
-
32
-
33
-
34
-
35
-
36
-
37
-
38
-
39
-
40
-
41
-
42
-
43
-
44
-
45
-
46
-
47
-
48
-
49
-
50
-
51
-
52
-
53
-
54
-
55
-
56
-
57
-
58
-
59
-
60
-
61
-
62
-
63
-
64
-
65
-
66
-
67
-
68
-
69
-
70
-
71
-
72
-
73
-
74
-
75
-
76
-
77
-
78
-
79
-
80
-
81
-
82
-
83
-
84
-
85
-
 86
86 -
 87
87 -
 88
88 -
 89
89 -
 90
90 -
 91
91 -
 92
92 -
 93
93 -
 94
94 -
 95
95 -
 96
96 -
 97
97 -
 98
98 -
 99
99 -
 100
100 -
 101
101 -
 102
102 -
 103
103 -
 104
104 -
 105
105 -
 106
106 -
107
-
108
-
109
-
110
-
111
-
112
-
113
-
114
-
115
-
116
-
117
-
118
-
119
-
120
-
121
-
122
-
123
-
124
-
125
-
126
-
127
-
128
-
129
-
130
-
131
-
132
-
133
-
134
-
135
-
136
 |
 |

eBay Inc.
NOTES TO CONSOLIDATED FINANCIAL STATEMENTS — (Continued)
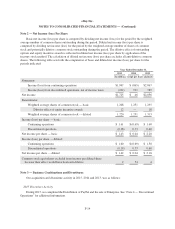
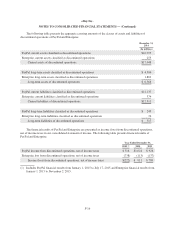
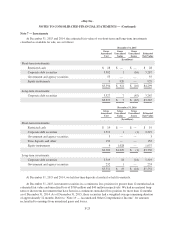
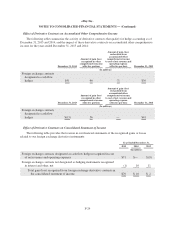
The following table sets forth the breakdown of net revenues by type:
Year Ended December 31,
2015 2014 2013
(In millions)
Net Revenues by Type:
Net transaction revenues:
Marketplace $6,103 $6,351 $5,900
StubHub 725 629 653
Total net transaction revenues 6,828 6,980 6,553
Marketing services and other revenues:
Marketplace 1,078 1,103 1,090
Classifieds 703 716 621
Corporate and other (17) (9) (7)
Total marketing services and other revenues 1,764 1,810 1,704
Total net revenues $8,592 $8,790 $8,257
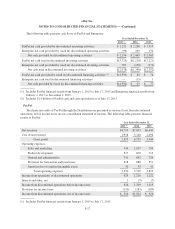
The following table summarizes the allocation of net revenues based on geography:
Year Ended December 31,
2015 2014 2013
(In millions)
Net revenues by Geography:
U.S. $3,624 $3,525 $3,419
United Kingdom 1,403 1,464 1,290
Germany 1,310 1,511 1,466
Rest of world 2,255 2,290 2,082
Total net revenues $8,592 $8,790 $8,257
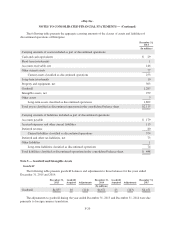
The following table summarizes the allocation of long-lived tangible assets based on geography:
December 31,
2015 2014
(In millions)
Long-lived tangible assets by Geography:
U.S. $1,668 $1,578
International 116 132
Total long-lived tangible assets $1,784 $1,710
Net revenues are attributed to U.S. and international geographies primarily based upon the country in which
the seller, platform that displays advertising, other service provider, or customer, as the case may be, is located.
Long-lived assets attributed to the U.S. and international geographies are based upon the country in which the
asset is located or owned.
F-22