eBay 2015 Annual Report Download - page 77
Download and view the complete annual report
Please find page 77 of the 2015 eBay annual report below. You can navigate through the pages in the report by either clicking on the pages listed below, or by using the keyword search tool below to find specific information within the annual report.-
 1
1 -
2
-
3
-
4
-
5
-
6
-
7
-
8
-
9
-
10
-
11
-
12
-
13
-
14
-
15
-
16
-
17
-
18
-
19
-
20
-
21
-
22
-
23
-
24
-
25
-
26
-
27
-
28
-
29
-
30
-
31
-
32
-
33
-
34
-
35
-
36
-
37
-
38
-
39
-
40
-
41
-
42
-
43
-
44
-
45
-
46
-
47
-
48
-
49
-
50
-
51
-
52
-
53
-
54
-
55
-
56
-
57
-
58
-
59
-
60
-
61
-
62
-
63
-
64
-
65
-
66
-
 67
67 -
 68
68 -
 69
69 -
 70
70 -
 71
71 -
 72
72 -
 73
73 -
 74
74 -
 75
75 -
 76
76 -
 77
77 -
 78
78 -
 79
79 -
 80
80 -
 81
81 -
 82
82 -
 83
83 -
 84
84 -
 85
85 -
 86
86 -
 87
87 -
88
-
89
-
90
-
91
-
92
-
93
-
94
-
95
-
96
-
97
-
98
-
99
-
100
-
101
-
102
-
103
-
104
-
105
-
106
-
107
-
108
-
109
-
110
-
111
-
112
-
113
-
114
-
115
-
116
-
117
-
118
-
119
-
120
-
121
-
122
-
123
-
124
-
125
-
126
-
127
-
128
-
129
-
130
-
131
-
132
-
133
-
134
-
135
-
136
 |
 |

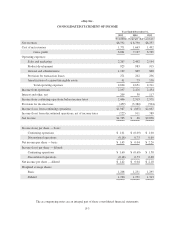
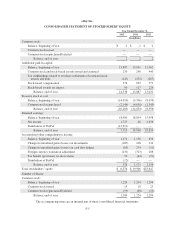
eBay Inc.
CONSOLIDATED STATEMENT OF INCOME
Year Ended December 31,
2015 2014 2013
(In millions, except per share amounts)
Net revenues $8,592 $ 8,790 $8,257
Cost of net revenues 1,771 1,663 1,492
Gross profit 6,821 7,127 6,765
Operating expenses:
Sales and marketing 2,267 2,442 2,144
Product development 923 983 915
General and administrative 1,122 889 880
Provision for transaction losses 271 262 236
Amortization of acquired intangible assets 41 75 136
Total operating expenses 4,624 4,651 4,311
Income from operations 2,197 2,476 2,454
Interest and other, net 209 39 117
Income from continuing operations before income taxes 2,406 2,515 2,571
Provision for income taxes (459) (3,380) (504)
Income (loss) from continuing operations $1,947 $ (865) $2,067
Income (loss) from discontinued operations, net of income taxes (222) 911 789
Net income $1,725 $ 46 $2,856
Income (loss) per share — basic:
Continuing operations $ 1.61 $ (0.69) $ 1.60
Discontinued operations (0.18) 0.73 0.60
Net income per share — basic $ 1.43 $ 0.04 $ 2.20
Income (loss) per share — diluted:
Continuing operations $ 1.60 $ (0.69) $ 1.58
Discontinued operations (0.18) 0.73 0.60
Net income per share — diluted $ 1.42 $ 0.04 $ 2.18
Weighted average shares:
Basic 1,208 1,251 1,295
Diluted 1,220 1,251 1,313
The accompanying notes are an integral part of these consolidated financial statements.
F-3